Double-Deflator Approach: Analysing Real Value Added and Sectoral Growth Disparities Between Manufacturing and Agriculture
Introduction:
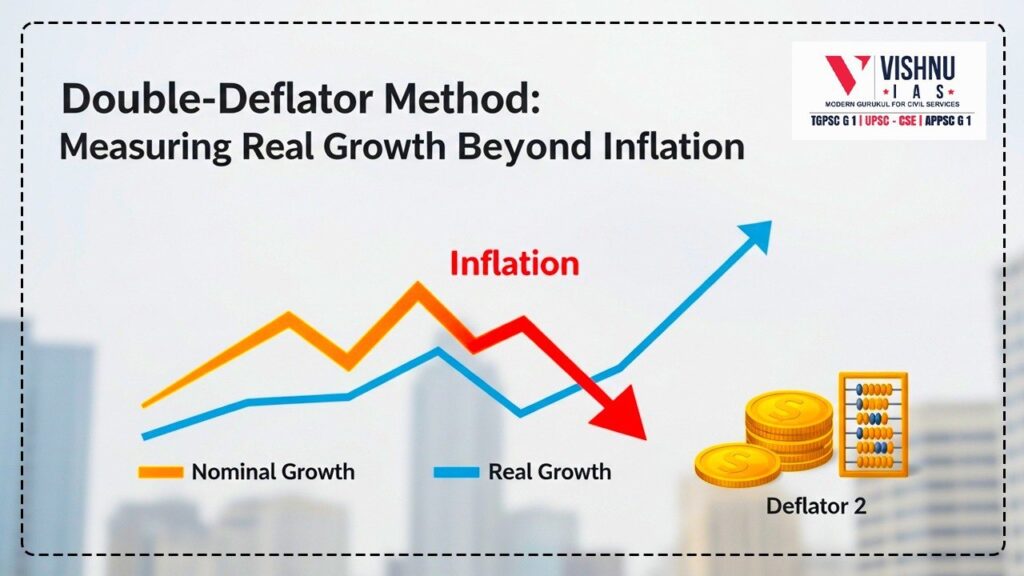
The Double-Deflator Approach improves the estimation of real value added by separately adjusting output and intermediate inputs for inflation, offering a clearer picture of sectoral growth disparities between manufacturing and agriculture.
- Gross Value Added (GVA) measures the value of output minus intermediate consumption and forms the backbone of estimating real economic growth. The updating of India’s national accounts base year to 2022–23 and the adoption of the double-deflator approach represent a structural methodological reform in national income accounting.
- Under this method, both output and intermediate inputs are deflated separately, allowing a more accurate estimation of real value added after adjusting for inflation. At a time when India’s economy is estimated at around ₹345 lakh crore in 2025–26 (approximately $3.8 trillion) with a projected growth rate of about 7.6%, methodological precision becomes critical—particularly in sectors such as manufacturing and agriculture, where price volatility and input-output linkages differ significantly.
- The reform thus has important implications for understanding sectoral growth disparities, fiscal planning, and structural transformation.
Body
I. Conceptual and Statistical Significance of the Double-Deflator Approach
1. Improved Measurement of Real Value Added
- By deflating gross output and intermediate consumption separately, the approach captures inflationary divergence between inputs (e.g., fuel, fertilisers, imported components) and final products, unlike the earlier single-deflation method, which risked over- or under-estimation of growth.
- In manufacturing, where input costs such as crude oil, metals, and semiconductors fluctuate significantly, this method prevents artificial inflation of growth during periods of high output prices but even higher input costs.
- In agriculture, where terms of trade often shift due to MSP revisions or global commodity prices, the double-deflator reveals whether real farm value addition is genuinely rising or merely price-driven.
2. Enhanced Sectoral Accuracy through Data Integration
- Use of Goods and Services Tax (GST) data, Annual Survey of Unincorporated Sector Enterprises (ASUSE), and Periodic Labour Force Survey (PLFS) strengthens the empirical base, especially for the informal manufacturing and agricultural segments.
- Allocation of multi-sector corporate output proportionately corrects earlier distortions where diversified companies’ activities were attributed disproportionately to a single sector.
- For instance, agro-processing firms earlier classified primarily under manufacturing may now have more accurately distributed output between agriculture-linked and industrial activities.
3. Alignment with International Best Practices
- The double-deflator approach is consistent with global statistical standards under the System of National Accounts (SNA) framework, improving cross-country comparability.
- Countries with diversified production structures adopt similar methods to capture supply-chain complexities, particularly in economies with growing integration into global value chains.
- For India, where manufacturing’s share in GVA is around 16–17% and agriculture around 15–16%, even small statistical corrections can alter perceptions of structural transformation.
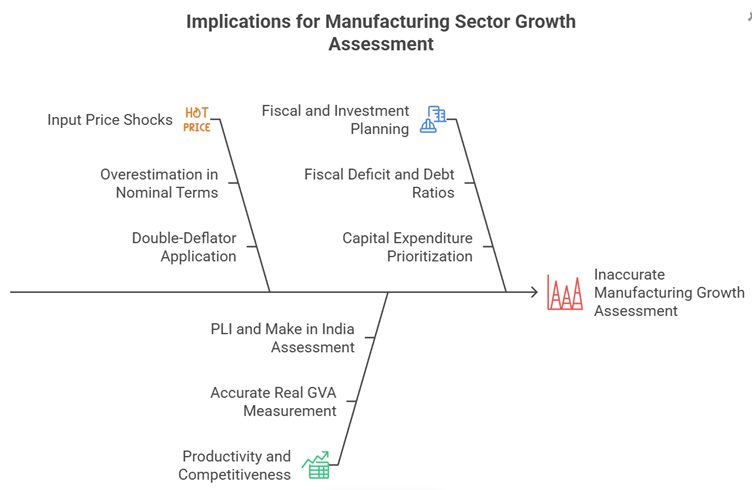
II. Implications for Manufacturing Sector Growth Assessment
1. Correcting Overestimation during Input Price Shocks
- Manufacturing growth often appeared robust in nominal terms during periods of rising output prices, even when margins were squeezed by costlier imports of energy and raw materials.
- The double-deflator accounts for the fact that during episodes like global commodity price spikes, intermediate inputs rose faster than final product prices, reducing real value added.
- Example: Post-pandemic supply chain disruptions saw elevated steel and energy prices; accurate deflation ensures that manufacturing growth reflects productivity rather than inflation pass-through.
2. Revealing Productivity and Competitiveness Trends
- Real GVA measured accurately enables better assessment of schemes like Production Linked Incentive (PLI) and Make in India, which aim to raise manufacturing’s GDP share to 25%.
- If growth under PLI sectors—such as electronics or pharmaceuticals—remains robust even after double deflation, it signals genuine productivity gains rather than price-driven expansion.
- Case Study: Mobile manufacturing expansion shows rising export volumes; double-deflation helps isolate volume growth from price effects in high-value electronics exports.
3. Fiscal and Investment Planning Implications
- Since fiscal deficit and debt ratios are measured relative to nominal GDP, a downward revision in economic size tightens fiscal space.
- Accurate sectoral growth data influences capital expenditure prioritisation, especially under initiatives such as PM Gati Shakti and the National Infrastructure Pipeline.
- A clearer picture of real manufacturing momentum assists in calibrating industrial credit flows and monetary policy responses.
III. Implications for Agriculture and Structural Disparities
1. Capturing Volatility in Agricultural Value Addition
- Agriculture is highly sensitive to monsoon variability, MSP changes, and global commodity cycles; output prices may rise even when production volumes stagnate.
- The double-deflator separates inflation in fertilisers, diesel, and seeds from farm-gate output prices, preventing exaggerated real growth estimates.
- Example: Years of high food inflation may show strong nominal agricultural growth, but real value added may remain modest after adjusting for rising input costs.
2. Understanding Rural Income Dynamics and Informality
- Integration of ASUSE and PLFS improves measurement of unincorporated enterprises and disguised employment in rural areas.
- Accurate real GVA helps assess the effectiveness of schemes such as PM-KISAN, Pradhan Mantri Fasal Bima Yojana, and e-NAM in enhancing farm incomes beyond inflation effects.
- Case Study: Diversification into horticulture and dairy in states like Gujarat and Maharashtra shows value-chain upgrading; double deflation reveals whether such diversification translates into genuine real income growth.
3. Highlighting Persistent Structural Gaps
- If manufacturing growth accelerates in real terms while agricultural real value addition remains subdued, it confirms ongoing structural transformation but also signals rural distress risks.
- Conversely, if agricultural growth appears stronger after accurate deflation, it may indicate resilience driven by allied sectors such as fisheries and livestock.
- The approach thus clarifies whether the gap between farm and non-farm productivity is widening or narrowing, informing policies under Doubling Farmers’ Income strategy and rural skilling initiatives.
Conclusion
- The adoption of the double-deflator approach marks a substantive improvement in measuring real economic performance by separating price effects in output and inputs, thereby producing a more reliable estimate of real value added. In an economy growing at around 7–8% annually but recently revised downward in absolute size by nearly 3–4%, precision in sectoral measurement is crucial for fiscal consolidation, structural transformation, and inclusive growth.
- By offering clearer insights into whether manufacturing gains reflect productivity improvements and whether agricultural growth translates into real income enhancement, the method strengthens evidence-based policymaking.
- Going forward, sustained improvements in high-frequency data collection, deeper integration of GST analytics, and improved measurement of informal and agri-allied activities can ensure that national accounts better capture the realities of a rapidly transforming $3.8 trillion economy striving toward higher income status.
Recap: