ECONOMIC SURVEY 2020-2021
CHAPTER – 1
“State of the Economy 2020-21: A Macro View”
Introduction
- The year 2020 was predominated by the COVID-19 pandemic, posing the most formidable economic challenge to India and to the world, since the Global Financial Crisis.
- Policymakers faced a dilemma of “lives versus livelihoods, i.e., flattening the disease curve would invariably entail steepening of the recession curve.
- Around the globe, governments and central banks deployed a range of policy tools such as lowering key policy rates, quantitative easing measures, loan guarantees, and fiscal stimuli.
- India recognised the disruptive impact of the pandemic and charted its own unique path amidst different dismal projections given its huge population, high population density and an overburdened health infrastructure.
- India’s policy humane response focused on saving human lives, recognised that the short-term pain of an initial, stringent lockdown would lead to long- term gains both in the lives saved and in the pace of the economic recovery.
Measures resorted by India to overcome economic contractions
- Minimizing losses: The policy response was driven by the findings from both epidemiological and Economic research. The policy focused on minimizing losses in a worst case scenario.
- Saving lives: India’s policy humane response focused on saving human lives.
- Minimizing supply-side disruptions: The slew of reforms was implemented to ensure that the supply-side disruptions are minimized in the medium to long-run.
Response of the Government
- Government of India launched Emergency Credit Line Guarantee Scheme to provide much needed relief to stressed sectors.
- A favorable monetary policy ensured abundant liquidity and immediate relief to debtors via temporary moratoria, while unclogging monetary policy transmission.
- Lockdown resulted in a 23.9 per cent contraction in GDP in Q1, the recovery has been a V-shaped one as seen in the 7.5 per cent decline in Q2 and the recovery across all key economic indicators.
- A sharp rise in commercial paper issuances, easing yields.
- Credit growth to MSME
Pandemic spread in India
- India imposed a stringent nation-wide lockdown during the initial phase of the pandemic in March- April, 2020, followed by gradual unlocking and phasing out of the containment measures.
- India crossed its peak in mid-September new cases have moved down in January, 2021.
- India’s share in new cases load globally has drastically come down from 31 per cent in September, 2020 to 4 per cent in December, 2020.
- India rapidly ramped up its capacity to rapidly scale-up tests.
Policy Dilemmas Underlying COVID-19
- Given the fast spread of the pandemic, the immediate public health policy priority was, ‘flattening the epidemiological curve’ to mitigate the impact of the spread.
- COVID-19, therefore led the world to the predicament of saving ‘lives’ or ‘livelihoods’ as the steps taken to flatten the infection curve, steepened the macroeconomic recession curve.
Demand-side and Supply-side Shocks (Twin Economic Shock)
- Demand Side: Increased uncertainty, lower confidence, loss of incomes, weaker growth prospects, fear of contagion, curtailment of spending options due to closure of all contact-sensitive activities, the triggering of precautionary savings, risk aversion among businesses and resultant fall in consumption and investment – leading to the first order demand shock.
- Supply Side: The supply chain disruptions caused by closure of economic activity and restricted movement of labour lead to the first order supply shocks.
Global Economy Disruption due to Pandemic
- The month of April 2020 became the month of “Global Lockdown” with world economic activity coming to a standstill–leading to a steep fall in output duringsecondquarterof2020.
- Global output is expected to witness the sharpest contraction in a century, contracting in the range of 3.5 – 4.3 per cent in 2020 as per the estimates provided by IMF and World Bank.
- The pandemic induced border closures and supply disruptions interrupted the international provision of goods and services.
- Global trade is projected to contract by 9.2 per cent in 2020—comparable to the decline during the 2009 global recession but affecting a markedly larger share of economies.
- Trade has, however, played a critical role in responding to the pandemic, allowing countries to secure access to vital food and medical supplies.
- The recovery in oil prices was more modest amid concerns over the pandemic’s lasting impact on oil demand.
- Gold emerged as a safe-haven investment in the backdrop of the pandemic prices with prices increasing by 26.2 per cent in November, 2020 as compared to December, 2019.
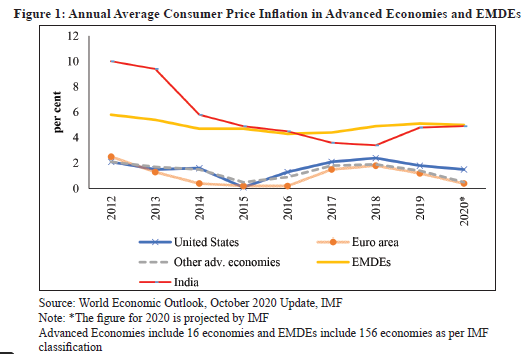
- Fall in inflation in EMDEs was less broad based than in AEs, reflecting the effects of sharp currency depreciations as well as rising domestic food prices in some countries.
- The pandemic has exacerbated the risks associated with a decade-long wave of global debt accumulation.
‘V-Shaped’ Trajectory
- The Indian economy, after subdued growth in 2019, had begun to regain momentum January 2020 onwards.
- Overall movement of high frequency indicators over Q1, Q2 and Q3 indicated speedy pickup in Q2 and growing convergence to pre-pandemic levels in Q3.
- Rural demand has remained resilient empowered by the government’s thrust on the rural economy and infrastructure in previous years.
- Critical steps such as PM-KISAN, adoption of cost plus 50 per cent formula for MSP, focus on irrigation via PM Krishi Sinchai Yojana, micro-irrigation scheme, promoting economies of scale through FPOs, and institutionalizing e-NAM (Electronic national agricultural market), and promotion of agricultural mechanization through subsidies and custom hiring centres.
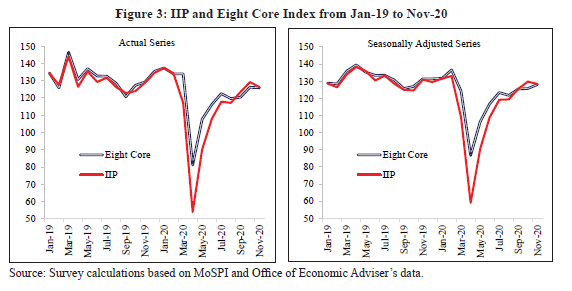
- A palpable V-shaped recovery in industrial production was observed over the year.
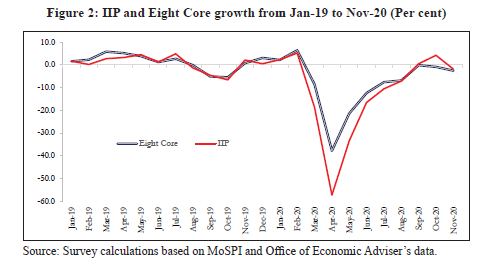
- The index of eight core industries, which make up around 40 per cent of the index, registered a growth of (-) 2.6 per cent in November, 2020 as compared to a growth of 0.7 per cent in November, 2019 and (-) 0.9 per cent in October, 2020.
Multi-Pronged Policy Response
- India adopted a graded four-pronged pre-emptive, and pro-active strategy consisting of (i) containment measures, (ii) calibrated fiscal support focused on essentials during lockdown and demand push during the unlock phase, (iii) financial measures and (iv) structural reforms to combat COVID-19.
- Food grains distribution programme, direct cash transfers to 42 crore individuals, more than 20 crore Women Jan Dhan accounts, cash support to building and construction workers, `30,000 crore additional emergency working capital funding for farmers through NABARD, additional pension payments, provision for free gas cylinders, additional allocation under MGNREGS, as well as government guarantees for credit, postponement of financial deadlines etc.
- Garib Kalyan Rojgar Abhiyaan (GKRA) was launched on 20th June,2020 for a period of 125 days in 116 districts of 6 States to boost employment and livelihood opportunities for migrant workers who had returned to their villages and similarly affected citizens in rural areas due to COVID-19 pandemic.
- Government of India also launched Emergency Credit Line Guarantee Scheme (ECLGS 1.0) to provide much needed relief to stressed sectors by helping entities sustain employment and meet liabilities.
- RBI undertook several conventional and unconventional liquidity enhancing measures included injection of durable liquidity of more than Rs 2.7 lakh crore through Open Market Operation (OMO) purchases.
- The Atmanirbhar Bharat Mission was announced with welfare measures to address the short-term distress of individuals and firms.
Conclusion
- The conservative estimates of different organizations reflect upside potential that can manifest due to the continued normalisation in economic activities as the rollout of Covid-19 vaccines gathers traction.
- This will further be supported by supply-side push from reforms and easing of regulations, push to infrastructural investments, boost to manufacturing sector through the Productivity Linked Incentive Schemes, recovery of pent-up demand for services sector, increase in discretionary consumption subsequent to roll-out of the vaccine and pick up in credit given adequate liquidity and low interest rates etc.
CHAPTER – 2
“Fiscal Developments”
Introduction:
- India adopted a calibrated approach best suited for a resilient recovery of its economy from COVID-19 pandemic impact, in contrast with a front-loaded large stimulus package adopted by many countries
- Expenditure policy in 2020-21 initially aimed at supporting the vulnerable sections but was re-oriented to boost overall demand and capital spending, once the lockdown was unwound
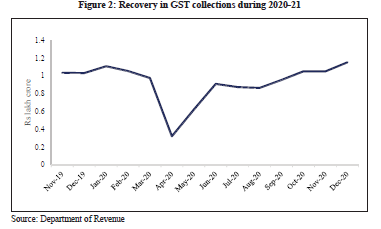
- Monthly GST collections have crossed the Rs. 1 lakh crore mark consecutively for the last 3 months, reaching its highest levels in December 2020 ever since the introduction of GST
- Reforms in tax administration have begun a process of transparency and accountability and have incentivized tax compliance by enhancing honest tax-payers’ experience
- Central Government has also taken consistent steps to impart support to the States in the challenging times of the pandemic
Performance of Fiscal Indicators
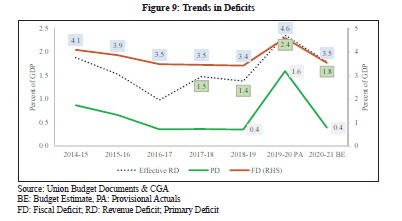
- Fiscal deficit: The fiscal deficit of the Central Government at end November 2020 stood at 135.1 per cent of the BE compared to 114.8 per cent during the same period in 2019-20.
- The non-debt receipts have been adversely hit by the slump in economic activity after the pandemic.
- During April to November 2020, the non-debt receipts have registered a growth of -17.9 percent relative to the corresponding period last year.
- Gross Tax Revenue: The Gross Tax Revenue during the first eight months of 2020-21 was 10.26 lakh crore, 42% of BE, 12.6 per cent lower than in the same period last year. This decline was owing to the negative growth in all direct taxes and major indirect taxes, except excise duties. In particular, the shortfall in direct tax collection contributed to 92 per cent of the shortfall in Gross Tax Revenue.
- Indirect Taxes: The shortfall in indirect taxes during April to November 2020 was led by shortfall in customs and GST collections for the Centre. This shortfall was partly off set by the revenue collection through the excise duties, which rose by 48 per cent during the first eight months of the fiscal relative to the same period last year.
- Disinvestment: The adverse market conditions arising due to COVID-19 have also negatively impacted the Government’s plans to achieve the target for disinvestment receipts. As on 20th January, 2021, the Government has been able to raise 15,220 crore only.
- Revenue expenditure: The revenue expenditure has grown by 3.7 per cent during the first eight months of 2020-21 compared to the same period in 2019-20. The monthly accounts data up to November 2020 shows that subsidies registered a negative growth of 14 per cent during the first eight months of FY 2020-21.
Fiscal Policy Response to COVID-19 across the Globe
- The fiscal measures adopted have been diverse, comprising of above the line measures, below the line measures and contingent liabilities (guarantees, quasi-fiscal operations).
- “Above-the-line” measures include those for which full cost is reflected in the fiscal deficit , government debt, and increased borrowing needs in the short term.
- These measures include additional spending (for example, health services and unemployment benefits); capital grants and targeted transfers (for example, wage subsidies or direct transfers); or tax measures (for example, tax cuts or other relief) provided through standard budget channels.
- “Below-the-line” measures are defined as generally involve the creation of assets, like equity injections, loans, asset purchase etc., which may have little or no upfront impact on the fiscal deficit all although they can later increase debt or reduce liquidity.
- Government of India announced above-the-line measures equivalent to 2.2 per cent of GDP and other liquidity support measures of around 5.3 per cent of GDP up to September, 2020.
- Additional fiscal measures equivalent to 1.7 per cent of GDP were introduced by the Government of India in October & November 2020.
- Although India’s measures were smaller than those of other developed countries, they were successful in facilitating a recovery in the economy.
- This also leaves India with a greater elbow room to deploy fiscal resources in the future.
Fiscal Stimulus by Government of India
- Government of India and RBI together announced a total stimulus worth Rs 29.87 lakh crore, which is 15% of national GDP. Out of this, stimulus worth 9% of GDP has been provided by the Government under Atmanirbhar Bharat Package.
- This stimulus was provided in the following tranches:
- Special economic and comprehensive package, announced from 13-17 May 2020
- Measures to stimulate consumer spending in the economy announced on 12 October 2020
- Measures under Atmanirbhar Bharat 3.0 announced on 12 November 2020.
Reforms in Tax Administration
- Reforms in tax administration have set in motion a process of transparency, accountability and more importantly, enhancing the experience of a tax-payer with the tax authority, thereby incentivizing tax compliance.
- Some of the major steps in this direction are:
- ‘Honoring the Honest’ Platform:The platform for ‘Transparent taxation- Honoring the Honest’ was launched in August 2020 with an objective to impart greater efficiency, transparency and accountability, and to eliminate physical interface between taxpayers and tax officers.
- Faceless Assessment Scheme 2020: It was based on the idea that automated random allocation of cases across Income Tax teams with dynamic jurisdiction and elimination of face to- face contact between the income-tax authorities and the taxpayer can lead to an efficient, nondiscretionary, unbiased single window system of assessment.
- The scheme establishes a National Faceless Assessment Centre (NFAC) in Delhi, headed by Principal Chief Commissioner of Income Tax, as the sole point of contact between the Department and the taxpayer.
- Faceless Appeals Scheme 2020: Under this scheme, all Income Tax appeals will be finalized in a faceless manner under the faceless ecosystem with the exception of appeals relating to serious frauds, major tax evasion, sensitive & search matters, International tax and Black Money Act.
- The Scheme establishes a National Faceless Appeal Centre (NFApC) as the apex body for conduct of e-appeal proceedings in a centralized manner.
- Taxpayers’ Charter:The taxpayer’s charter for India comprises of commitments by the Income Tax Department and obligations of the taxpayers.
Trends in Government Finances: States and General Government
- State Finances
- States had budgeted for a consolidated gross fiscal deficit of 2.8 per cent of GDP in 2020-21 BE.
- The average Gross Fiscal Deficit Budget Estimate for states that presented their budgets before the outbreak of COVID-19 was 2.4 per cent of GSDP, while the average for budgets presented post lockdown was 4.6 per cent of GSDP.
- The RBI Study on State Finances highlights the decline in actual capital spending relative to BE observed in the states for the last 3 years.
General Government Finances
- The General Government finances give an overview of fiscal position of the Government sector as a whole.
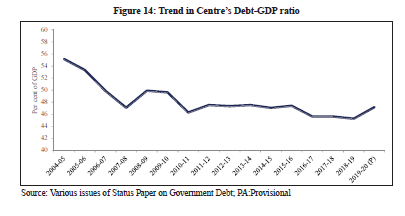
- The General Government liabilities as a proportion of GDP exhibit an increasing trend over the last few years. In the wake of the global pandemic outbreak, the General Government (Centre plus States) is expected to register a fiscal slippage on account of the shortfall in revenue and higher expenditure requirements.
- As indicated by the enhanced borrowing provisions for both the Centre and the States for 2020- 21, the liabilities of the General Government are expected to increase. This deviation from the path of fiscal consolidation may however be transient as the fiscal indicators may rebound with the recovery in the economy.
Measures taken by the Centre to Support the States in Times of COVID-19
- Enhanced limit of borrowing for FY2020-21 under Atmanirbhar Bharat Package: Additional borrowing limit of up to 2 percent of Gross State Domestic Product (GSDP) was allowed to the States, which was equivalent to Rs 4.27 lakh crore.
- Compensation to the States for loss in GST revenue: Central Government had given the states an option to either borrow the shortfall arising out of GST implementation through issue of debt under a Special Window coordinated by the Ministry of Finance which was passed on to the States and Uts (Option 1), or raise the entire shortfall through the issue of market debt (Option 2).
- Scheme for Special Assistance to States for Capital Expenditure: The Scheme aimed to re-orient the focus of the States’ fiscal policy on capital expenditure,
- SDRF: The Central Government by way of a special one-time dispensation had decided to treat COVID-
- 19 as a notified disaster for the purpose of providing assistance under SDRF.
CHAPTER – 3
“External Sector”
Introduction:
- COVID-19 pandemic led to a sharp decline in global trade, lower commodity prices and tighter external financing conditions with implications for current account balances and currencies of different countries
- India’s forex reserves at an all-time high of US$ 586.1 billion as on January 08, 2021. India to end with an Annual Current Account Surplus after a period of 17 years.
- Parameters in April-December 2020 compared to same period last year.
- Pharma exports, in particular, used this opportunity to enhance their share in total India’s exports and indicate India’s potential to be the pharmacy of the world.
- These developments have led to accretion of foreign exchange reserves that rose to an all-time high of US$ 586.1 billion as on January 8, 2021
Global Economic situation
- The spread of the pandemic led to associated suspension of economic activities, supply-chain disruptions, travel restrictions and volatility in international commodity prices.
- There was an impressive export performance of few countries such as Vietnam, Taiwan, and Malaysia, and their continuous narrowing contraction in imports in subsequent quarters.
- As per IMF’s October Global Financial Stability Report 2020, near-term global financial stability risks have been contained for now due to the unprecedented and timely policy responses to maintain the flow of credit to the economy and avoided adverse macro-financial feedback loops, thereby creating a bridge to recovery.
India: Potential to be the “pharmacy of the world”
- Indian pharmaceutical industry is third largest in the world, in terms of volume, behind China and Italy and 14th largest in terms of value.
- India was at 11th position in terms of share in world pharma exports in 2019 with Germany, Switzerland and USA occupying the top three positions.
- India is the only country with largest number of US-FDA compliant pharma plants (more than 262 including APIs) outside of USA.
- The pandemic, however, exposed the excessive dependence of Indian pharmaceutical industry on China for sourcing Active Pharmaceutical Ingredients (APIs) and Key Starting Materials (KSMs).
- A well-defined strategy for broad based development of the industry needs to include the following components:
- Broaden base in terms of markets, as well as product categories:
- increasing exports to large and traditionally underpenetrated markets such as Japan, China, Africa, Indonesia, Russia/CIS countries, Brazil and Latin America, can usher-in the next leg of growth for Indian pharma industry.
- Restructure the current regulatory mechanism and upgrade and build capacities at various National Institute of Pharmaceutical Education and Research (NIPERs).
- Greater R&D Expenditure to move up the value chain from generics to Novel Chemical Entities (NCEs).
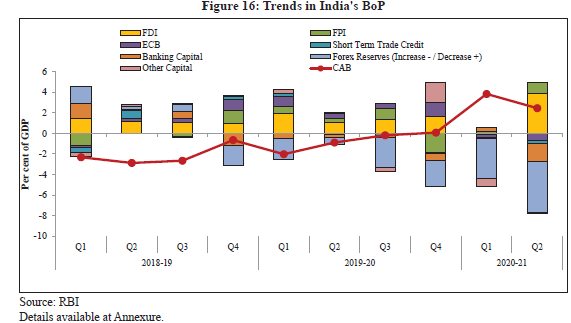
Current Account of BOP
- India’s current account deficit averaged 2.2 per cent of GDP in the last 10 years. Reversing this trend, current account balance turned into surplus (0.1 per cent of GDP).
Foreign Exchange Reserves of India
- India’s forex reserves at an all-time high of US$ 586.1 billion as on January 08, 2021.
- Thus India is the fifth largest foreign exchange reserves holder among all countries of the world after China, Japan, Switzerland and Russia.
- The rise in the foreign exchange reserves of the RBI has largely been due to the current account surplus which, in turn, is largely due to contraction in imports rather than increase in competitiveness of exports.
- The current account balance, in economic terms, is synonymous with the Savings-Investment balance.
- A current account surplus implies a higher level of national savings relative to investment.
- A rise in foreign exchange reserves also represents investments in bonds/ securities of other countries in effect investing abroad.
Initiatives taken by Government to boost exports
- Trade Facilitation – A National Committee on Trade Facilitation (NCTF) was, accordingly, constituted in India in August 2016 with the Cabinet Secretary as the Chair to reduce trade barriers caused by inefficient and overly burdensome regulatory administrative procedures.
- Remission of Duties and Taxes on Exported Products (RoDTEP) – Government has rolled out a new
- WTO compliant scheme, namely Remission of Duties and Taxes on Exported Products (RoDTEP), for all export goods.
- Production-Linked Incentive (PLI) Scheme – In order to boost domestic manufacturing and exports, the Production-Linked Incentive (PLI) scheme.
- Trade Related Logistics – India’s rank has improved significantly in trading across borders parameter of ‘Ease of Doing Business’ index from 146 in 2018 to 68 in 2020. The Logistics Performance Index (LPI), released by the World Bank, assesses relative logistics efficiency of countries. On this index,
- India was ranked 44 out of 160 countries in 2018 vis-à-vis rank of 54 in 2014.
Some Infrastructure Initiatives which are at various stages of implementation are:
- Bharatmala Pariyojana is a new umbrella program for the highways sector that envisages building more than 80,000 Km of roads, highways, green field expressways, bridges.
- Sagarmala aims at Port Modernization & New Port Development, Port Connectivity Enhancement, Port-linked Industrialization, Coastal Community Development and giving impetus to Coastal Shipping.
- Multi-Modal Logistics Parks shall act as hubs for freight movement enabling freight aggregation, distribution and multi-modal transportation. They would provide modern mechanized warehousing space and value-added services such as customs clearance with bonded storage yards, warehousing management services, etc.
- Dedicated Freight Corridors (DFCs) aims at reduction in unit cost of transportation with higher speed of freight trains and better turnaround of wagons. Around 70 per cent of freight is expected to shift to DFC, freeing up capacity on Indian Railways.
Trade Infrastructure for Export Scheme (TIES) aims to assist creation of appropriate infrastructure for growth of exports from the States
Conclusion
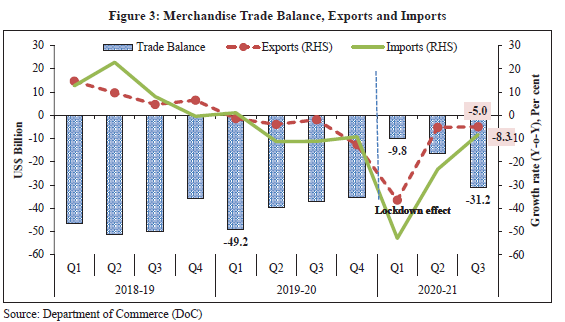
- The disruption of global manufacturing value chains due to the COVID-19 pandemic presents a tremendous opportunity for India to become one of the key nodes in the chain.
- Improving trends in India’s merchandise trade have been supplemented by equity capital inflows, robust FDI inflows and sustained build-up of foreign exchange reserves.
- The comfortable foreign exchange reserves give the much-needed space for enhanced domestic investments.
CHAPTER – 4
“Monetary Management and Financial Intermediation” Financial Intermediation”
Introduction:
- Given the unprecedented shock of COVID-19 pandemic, monetary policy was significantly eased from March 2020 onwards.
Monetary Developments During 2020-21
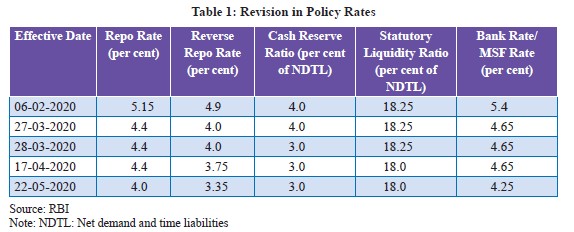
- Repo Rate: The repo rate has been cut by 115 bps since March 2020, with 75 bps cut in first Monetary Policy Committee (MPC) meeting in March 2020 and 40 bps cut in second meeting in May 2020.
- Reverse Repo Rate: The reverse repo rate was reduced from 4.90 per cent to 3.35 per cent.
- Systemic liquidity in FY2020-21 has remained in surplus so far. RBI under tookvarious conventional and unconventional measures like:
- o Open Market Operations
- o Long Term Repo Operations
- o Targeted Long Term Repo Operations
Liquidity Conditions and Its Management
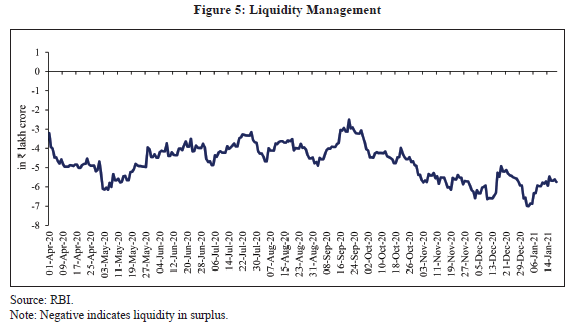
- The systemic liquidity in 2020-21 so far has consistently remained in surplus reflecting several liquidity enhancing measures undertaken by the Reserve Bank in the wake of COVID-19 induced disruptions.
- The main drivers of liquidity during 2020-21 have been Currency in Circulation (CIC), Government cash balances and the Reserve Bank’s forex operations. While CIC withdrawals and build-up of
- Government cash balances resulted in liquidity drainage from the banking system, the Reserve Bank’s forex operations augmented systemic liquidity.
These measures undertaken include:
- Open Market Operation (OMO) purchases
- OMOs in State Development Loans (SDLs) as a special case were also introduced Targeted Long Term Repo Operations (TLTROs) of up to three years’ tenor
- Reduction in the CRR requirement of banks
- Raising banks’ limit for borrowing overnight under the MSF
- Special Liquidity Facility for mutual funds for 50,000 crore
- Refinance facility worth 75,000 crore for all India financial institutions i.e., NABARD, NHB, SIDBI and EXIM Bank.
- The measures listed above coupled with forex purchases resulted in expansion of surplus liquidity.
- The increased government spending also added to the liquidity surplus.
- Inspite of various conventional and unconventional measures undertaken by RBI (like Open Market Operations, Long Term Repo Operations, Targeted Long Term Repo Operations etc) to manage liquidity situation in the economy, the financial flows to the real economy however remained constrained on account of subdued credit growth by both banks and Non-Banking Financial Corporations.
Banking Sector
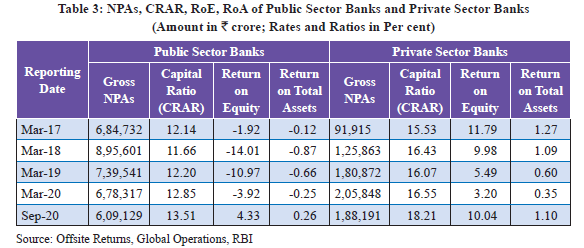
- Gross Non-Performing Advances (GNPA) ratio (i.e. GNPAs as a percentage of Gross Advances) of Scheduled Commercial Banks decreased from 8.2 per cent at the end-March 2020 to 7.5 per cent at end-September 2020. However, this has to be seen in conjunction with the asset classification relief provided to borrowers on account of the pandemic
- GNPA ratio of Public Sector Banks (PSBs) decreased from 10.25 per cent at the end- March 2020 to 9.4 per cent at end-September 2020
- Net NPA ratios also declined and stood at 2.1 per cent for SCBs and 2.85 per cent for PSBs as at end- September 2020.
- Capital to risk-weighted asset ratio (CRAR) of SCBs increased from 14.7 per cent to 15.8 per cent between March 2020 and September 2020
- The focus on resolution of stressed assets had to take a backseat during the year on account of the outbreak of the Covid-19 pandemic.
- Government had suspended the initiation of fresh insolvency proceedings under Section 7, 9 and 10 of Insolvency & Bankruptcy Code 2016 for defaults arising on or after March 25, 2020 till March 25, 2021.
- Reserve Bank announced loan moratorium for 6 months, asset classification dispensation and special resolution framework for Covid-19 related stressed assets
Monetary Policy Transmission
- RBI has reduced repo rate by 250 bps since February 2019. The transmission of policy repo rate changes has been weak on quantity of credit. However, there has been improved transmission on rate structure and term structure.
- Rate structure: The transmission of policy repo rate changes to deposit and lending rates of scheduled commercial banks (SCBs) has improved since March 2020 reflecting the combined impact of policy rate cuts, large liquidity surplus with accommodative policy stance, and the introduction of external benchmark-based pricing of loans.
- Credit growth: Credit growth of banks slowed down to 6.7 per cent as on January 1,2021.The moderation in credit growth in 2020-21 was witnessed in mostly all the sectors, barring services
- Term structure: The reduction in policy rates and surplus liquidity helped in bringing down both the short term and long term interest rates. However, the impact has been much smaller on longer term interest rates.
Non-Banking Financial Companies (NBFC) Sector
- Credit growth of NBFCs continued to slow down. Credit growth (YoY) of the NBFC sector was close to 3 per cent in June 2020. Further, the credit growth contracted in September 2020 with a YoY growth of -6.6 per cent.
- NBFCs witnessed slowdown in their growth in 2019-20 largely due to isolated credit events in few large NBFCs and challenges in accessing funds.
- However, banks continued to support NBFCs with their lending expanding 9.2 per cent (YoY) till October 2020, well above the overall bank credit growth. The sector also benefitted from the liquidity infusing measures announced by the Reserve Bank during the pandemic that also included Targeted
- Long-Term Repo (TLTRO) Operations covering the NBFC sector.
Developments In Capital Markets
- Primary Markets (Equity)
- Public Issue: April-December 2020 witnessed an increase in resource mobilization through public issue compared to the similar period for previous year.
- Private Placement: April-December 2020 witnessed a decrease in resource mobilization through private placement route.
Primary Markets (Debt)
- The total debt issuance in primary market increased by 29.7 per cent to Rs 5.99 lakh crore during 2020- 21 (upto December) as compared to Rs 4.63 lakh crore in the corresponding period of the previous year.
- Bilateral Netting of Qualified Financial Contracts Bill was passed and has become operational since October 1, 2020.
Mutual Fund Activities
- There was a net in flow of Rs 2.76 lakh crore into the mutual funds industry during 2020-21 (upto December), as compared to a net in flow of Rs 1.82 lakh crore in the corresponding period of last year.
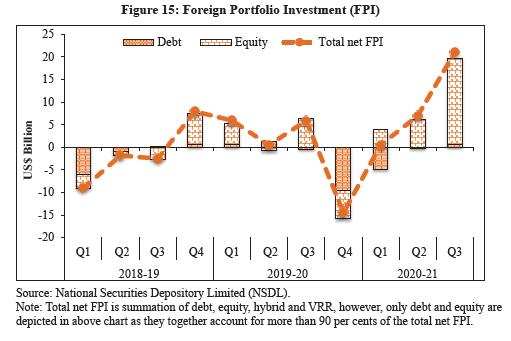
Investment By Foreign Portfolio Investors
- There were net inflows to the tune of Rs 2.1 lakh crore on account of the foreign portfolio investors (FPIs) in the Indian capital market during 2020-21 (up to December), as compared to net inflows of Rs 0.81 lakh crore during the same period in 2019-20.
Movement Of Indian Benchmark Indices
- During 2020-21 (upto January 20, 2021), India’s benchmark indices, namely, Nifty50 and S&P BSE Sensex index reached record highs of 14,644.7 and 49,792.1 respectively on January 20,2021.
- In view of the COVID-19 pandemic, various measures were undertaken by SEBI.
- In the period of moratorium by the RBI, if CRA is of the view that the delay in payment of interest/ principle has arisen solely due to the lockdown, CRAs may not consider the same as a default event and/or recognize default.
- Further, extension in timelines for press release and disclosures on website was also provided.
- SEBI granted temporary relaxation in processing of documents pertaining to FPIs
Insurance Sector
- The performance and potential of insurance sector is assessed using two indicators- Insurance penetration and Insurance Density.
- Insurance penetration is calculated as percentage of insurance premium to GDP.
- Insurance density is calculated as ratio of insurance premium to population.
- In India, Insurance penetration which was 2.71 per cent in 2001 has steadily increased to 3.76 per cent in 2019. In contrast, insurance penetration in Asia, i.e., Malaysia, Thailand and China were 4.72, 4.99 and 4.30 per cent respectively in 2019.
- The insurance density in India which was US$ 11.5 in 2001 reached to approximately US$ 78 in 2019.
- The comparative figures for Malaysia, Thailand and China in 2019 were much higher at US$ 536, US$ 389 and US$ 430 respectively.
Pension Sector
- The overall contribution under NPS grew by more than 30 per cent.
- As a measure during pandemic, the partial withdrawal from NPS has been allowed for treatment of COVID-19.
Insolvency And Bankruptcy Code
- Since the inception of the Code in December 2016, 4,117 applications have been admitted as on December 31, 2020.
- Nearly 23 per cent of the cases admitted were settled or withdrawn after the commencement of Corporate Insolvency Resolution Process (CIRP).
- The resolution rate for non-BIFR legacy cases is more than three times higher at 40 per cent when compared to BIFR cases
- Resolution: The Code has facilitated the recovery of NPAs by banks.
- Liquidation: Although the Code has rescued 308 Corporate Debtors (worth 1.03 lakh crore), 1112
- Corporate Debtors (worth 0.43 lakh crore) went into liquidation. Thus, in value terms, around three fourth of distressed assets were rescued
- Time: The 308 CIRPs, which have yielded resolution plans by the end of December 2020, took on average 441 days for the conclusion of the process. Similarly, the 1112 CIRPs, which ended up in orders for liquidation, took on average 328 days for the conclusion
- Cost: The cost works out on average 0.79 per cent of liquidation value and 0.42 per cent of resolution value.
- The Code has brought about significant behavioural changes among the creditors and debtors thereby redefining debtor-creditor relationship.
Regulatory measures in banking sector:
- Commercial Banks
- Merger of PSBs: Consolidation among another 10 PSBs, with Punjab National Bank, Canara Bank, Union Bank of India and Indian Bank as anchor banks came into effect from April 1, 2020.
- Restructuring of MSME loans: A one-time restructuring of loans to MSMEs that were in default but ‘standard’ as on January 1, 2019, was permitted, without an asset classifi cation downgrade, subject to certain conditions
- Export Credit: The maximum permissible period of pre-shipment and post-shipment export credit sanctioned by banks was increased from one year to 15 months
- Monetary policy transmission – external benchmarking of loans: With a view to strengthen the transmission of monetary policy, the banks were mandated to link all new floating rate personal or retail loans and floating rate loans extended to MSMEs to external benchmarks such as repo rate, Treasury Bill Rate and any external benchmark published by Financial Benchmarks India Pvt Ltd(FBIL).
Co-operative Bank
- Revision in the target for priority sector lending: To promote financial inclusion, the overall priority sector lending target for Urban Co-operative Banks has been increased from the present level of 40 per cent of adjusted net bank credit (ANBC) to 75 per cent of ANBC by March 31, 2024.
- Inclusion of co-operative banks as eligible member lending institutions under interest subvention scheme for MSMEs
- Reporting of large exposures to Central Repository of Information on Large Credits (CRILC): Urban Cooperative Banks (UCBs) with assets of Rs500 crore and above were brought under the CRILC reporting framework.
- The Banking Regulation Act 1949 has been amended by the Banking Regulation (Amendment) Act, 2020 under which the Reserve Bank has been given powers over the management of the UCBs
CHAPTER AT A GLANCE
- Monetary policy remained accommodative in 2020.
- The repo rate has been cut by 115 bps since March 2020.
- Systemic liquidity in 2020-21 remained in surplus so far. RBI undertook various conventional and unconventional measures like OMOs, Long Term Repo Operations,
- Targeted Long Term Repo Operations etc. to manage liquidity situation in the economy.
- The transmission of high reserve money growth to money supply growth was only partial, showing impaired liquidity transmission as the banks put money back with RBI under reverse repo.
- Credit growth of banks slowed down to 6.7 per cent as on January 1, 2021. The credit off takes from banking sector witnessed a broad-based slowdown.
- Gross Non-Performing Assets ratio of Scheduled Commercial Banks decreased from 8.21 per cent at the end of March 2020 to 7.49 per cent at the end of September 2020. However, this has to be seen in conjunction with the asset classification relief provided to borrowers on account of the pandemic.
- The monetary transmission of lower policy rates to deposit and lending rates improved in this year.
- Nifty 50 and S&P BSE Sensex reached record high closing of 14,644.7 and 49,792.12 on January 20, 2021 respectively.
- The recovery rate for the Scheduled Commercial Banks through IBC (since its inception) has been over 45 per cent.
- In view of COVID-19 pandemic, initiation of Corporate Insolvency Resolution Process (CIRP) was suspended for any default arising on or after March 25, 2020 for a period of 6 months. This was further extended twice for 3 months on September 24, 2020 and
- December 22, 2020. The suspension along with continued clearance of CIRPs allowed a small decline in accumulated cases.
CHAPTER – 5
“PRICES AND INFLATION”
Introduction
- CPI-Combined (C) inflation has moderated since 2013-14. However, inflation dynamics have changed considerably in 2020.
- Year 2020 was unprecedented with the global pandemic of COVID-19 induced social distancing disrupting economic activity globally.
- At the domestic level, two opposing forces were at play. On the one hand, there was a dampening of demand owing to lower economic activity.
- On the other hand, supply chain disruptions have caused spikes in food inflation that have continued to persist during the unlocking of the economy, though the effect has softened in the recent months.
Current Trends In Inflation
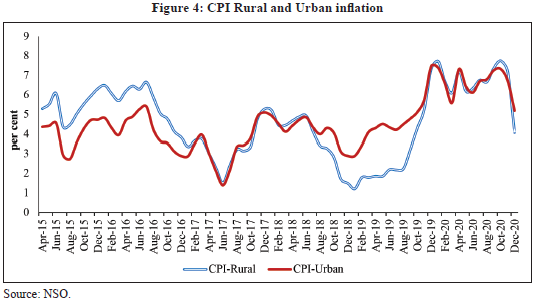
- Headline inflation based on CPI-Combined (CPI-C) was on a downward path from 2014 to 2018.
- However, a rising trend was observed since 2019.
- The average CPI-C inflation, which was 5.9 per cent in 2014-15, fell continuously to 3.4 per cent in 2018-19 and recorded 4.8 per cent in 2019-20. It however increased to 6.6 per cent in 2020-21 (Apr-Dec) before easing to a 15-month low of 4.6 per cent in December 2020.
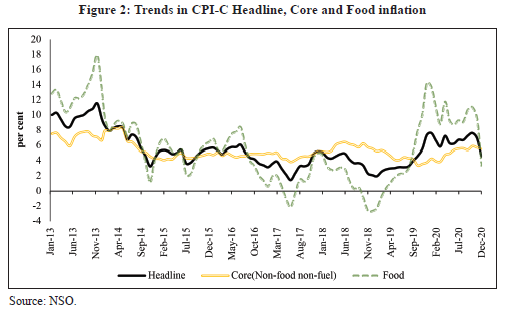
- Within various groups of CPI-C, the increase in inflation in the current year was mainly driven by rise in food inflation, which increased from 0.1 per cent in 2018-19 to 6.7 per cent in 2019-20 and further to 9.1 per cent in 2020-21 (Apr-Dec), owing to build up in vegetable prices. However, the swift steps taken by the Government eased food inflation significantly to 3.4 per cent in December 2020 from a high of 11 per cent in October 2020. CPI Core (non-food non-fuel) inflation declined from 5.8 per cent in 2018-19 to 4.0 per cent in 2019- 20 and averaged 5.4 per cent in 2020-21(Apr-Dec).
- Rise in core inflation in the current year is mainly because of miscellaneous group, which primarily consists of services. Inflation in transport & communication, which have maximum weightage in the miscellaneous group, increased to 9.4 per cent in the current year as compared to 2.4 per cent in 2019-20.
- WPI inflation declined from 4.3 per cent in 2018-19 to 1.7 per cent in 2019-20 and further to (-) 0.1 per cent in 2020-21 (Apr-Dec).
- WPI food inflation declined from 6.9 per cent in 2019-20 to 4.2 per cent in 2020-21 (Apr-Dec) and WPI core inflation increased to 0.8 per cent in 2020-21 (Apr-Dec) as compared to (-) 0.4 per cent in 2019- 20.
Drivers of Inflation
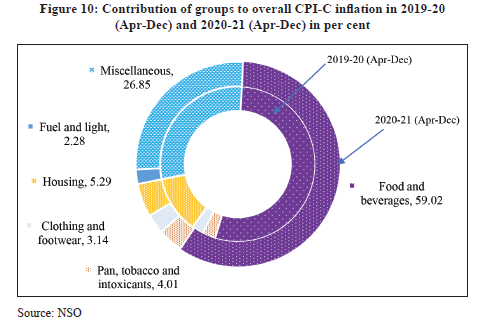
- During 2019-20 (Apr-Dec) as well as 2020-21 (Apr-Dec), the major driver of CPI-C inflation was the food and beverages group, though its contribution has increased to 59.0 per cent in 2020-21 (Apr-Dec) compared to 53.7 per cent in 2019-20 (Apr-Dec).
- Miscellaneous group was the second largest contributor to inflation, contributing to 26.8 per cent of overall inflation.
- High food inflation since March 2020 is indicative of supply chain bottlenecks owing to COVID-19
- The common person through its impact on the households’ food budget experiences the variations in the prices of essential food commodities. An attempt was made in this regard to assess the cost of a plate of food in Vol-I, Economic Survey, 2019-20 in the form of Thalinomics. induced disruptions.
Thalinomics: Cost of a plate of food in 2020-21
- The NSO has compiled the Thali index using the data collected by NSO for CPI-C.
- PDS prices for both rural and urban sectors and prices of items canvassed in respect of affluent markets in urban areas have been excluded.
- Thali cost represents the cost of a meal cooked within household but as it excludes PDS, consumption is wholly based on the transactional prices of the said components of thali.
- Thali cost have increased between June 2020 and November 2020, they witnessed a sharp fall in the month of December reflecting the fall in the prices of many essential food commodities.
- In 2020-21(Jun-Dec, 2020), the most expensive Veg thali in the rural areas was in Andaman &Nicobar Islands (` 38.7) while the cheapest in rural areas was in Uttar Pradesh (` 23.1).
Which Measure of Inflation Reflected Economic Activity Better in 2020-21?
- CPI-C inflation and WPI inflation have been moving more or less in tandem until beginning of 2019- 20.
- Between April-July 2020, WPI inflation has been in the negative region while CPI-C inflation has been above 6 per cent. The major feature in this widening gap is that this has happened in a period witnessing high food inflation.
- CFPI inflation has remained higher than non-food inflation. The movement in CPI-C inflation is quite contrary to the weak demand conditions prevalent in the economy in the recent months owing to theCOVID-19 crisis.
- Food items have a large weight of around 39 per cent in the CPI-C index. This means that shocks to food prices can have large impacts on CPI-C inflation.
- A tight monetary policy may have a role in managing inflation in case of excess demand driving high inflation. However, the current scenario presents a different picture.
- The current spike in CPI inflation driven by spike in food prices is mainly a supply-side phenomenon.
Headline inflation or core inflation
- Core inflation (inflation in the price index excluding food, fuel and other volatile components) has been viewed by many as the better measure of inflation for monetary policy purposes.
- This is because food and fuel price shocks are transitory as well as mainly supply driven and therefore not a monetary phenomenon. Theoretical work in the area has used models with price and/or wage stickiness to show that targeting core inflation maximizes welfare.
- In these models, the flexible price equilibrium is restored by central banks trying to minimize these fluctuations by targeting sticky prices.
- In the case of developing economies, there are two deviations from these assumptions: 1) inability of agents to smooth their lifetime consumption, and 2) other structural differences such as a high share of food in household consumption expenditure.
- Under complete markets, the choice of targeting strict core inflation is the best policy, with incomplete markets, headline inflation targeting is welfare improving relative to core inflation targeting.
Regulation of Drug Prices
- Drug prices in India are regulated to ensure continued availability and affordability of essential lifesaving drugs with improved access to consumers. National Pharmaceutical Pricing Authority (NPPA), which is an independent regulator for pricing of drugs and to ensure availability and accessibility of medicines at affordable prices, has played an active role in addressing the exigencies arising out of COVID-19 pandemic and undertook necessary measures to ensure continued availability of life saving essential medicines throughout the country.
Measures To Control Inflation
- The Government reviews the price situation regularly and has taken number of measures from time to time to stabilize prices of food items. In the wake of rising prices of pulses, onion and potato, the Government has taken several steps to improve the availability of these commodities and make them available to consumers at affordable prices.
These include
- Banning the export of onion
- Imposition of stock limit on onion under the EC Act to prevent hoarding
- Easing of restrictions on imports, facilitating imports at integrated check-posts, issuance of licenses for imports and reduction in import duties
- These measures have resulted in increased imports of onion, turdal and masurdal in the country and resultant cooling of prices.
Other measures to control undue price rise include:
- Price Stabilization Fund (PSF) Scheme is being efficiently implemented and has succeeded in achieving its objective of stabilizing prices of pulses and offered significant benefits to all stakeholders.
- Government has taken a decision that all Ministries/Department having schemes with nutrition component or providing food/ catering/hospitality services would utilize pulses from the central buffer. Pulses from the buffer are utilised for PDS distribution, in Midday Meal Scheme and in ICDS Scheme.
- Creation of buffer stock of pulses has helped in moderating pulses prices. Lower prices of pulses lead to consumer savings. Built buffer also led to remunerative prices to farmers as procurement for buffer was undertaken at MSP or higher rates from them.
- Subsequently, Government has decided that procurement at MSP would be under Price Support
- Scheme of Department of Agriculture, Cooperation and Farmers Welfare and requirement towards building suitable buffer would be met from the PSS stock in case procurement is not required to be undertaken under PSF.
- Pulses from the PSF buffer are also being utilized for free supplies under PMGKAY and
Conclusion
- During 2020-21, retail and wholesale inflation saw movements in the opposite directions. While headline CPI-C inflation saw an increase compared to the previous year, WPI inflation remained benign. Supply-side shocks especially owing to COVID-19 pandemic affected the retail inflation with food articles contributing to the overall rise in inflation. Government interventions to augment the supply of commodities as well as to ensure the provision of essentials have likely softened the impact of the pandemic.
- Food inflation has already eased in December reducing overall inflationary pressures. Going forward, as food inflation eases further, overall inflation is expected to moderate further.
CHAPTER – 6
“Sustainable Development and Climate Change”
Introduction
- The outbreak of the corona virus disease 2019 (COVID-19) has led to considerable human and economic costs setting countries back on their developmental goals and creating serious impediments to the attainment of the SDGs.
- The year 2020 was supposed to be the year by which developed country Parties were to fulfill the goal of jointly mobilizing US$ 100 billion a year for climate finance.
- India is no exception to the unprecedented crisis unleashed by the pandemic.
India and the SDGs
- India has taken several proactive steps at both the national and the sub national level to mainstream the SDGs into the policies, schemes and programmes of the Government.
- Voluntary National Review: In 2020, the highlight of India’s SDG initiatives has been the Voluntary National Review (VNR) presented to the United Nations High-Level Political Forum (HLPF) on
Sustainable Development.
- The reviews are voluntary and country -led and aimed at facilitating the sharing of experiences, including successes, challenges and lessons learned.
- NITI Aayog presented India’s second VNR to the HLPF in July 2020.
- Private sector spending: Corporate Social Responsibility (CSR) initiatives have been a major avenue for private sector involvement in the SDG framework.
- This is echoed in the ‘Report of the Committee on Business Responsibility Reporting’ which was released in 2020.
- BRSR formats incorporate the growing salience of non-financial disclosures along with the annual financial disclosures ensuring the recognition of environmental and social responsibilities.
- Localization of the SDGs: It involves the process of adapting, planning, implementing and monitoring the SDGs from national to local levels by relevant institutions and stakeholders.
- To accelerate SDG achievements, the country has adopted the approach of cooperative and competitive federalism which is based on Centre-State collaboration.
- The SDG India Index and Dashboard, designed and developed by NITI Aayog, is the principal tool to measure and monitor SDG performance at the national and sub-national levels:
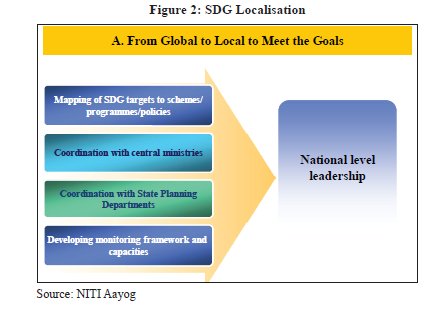
National Level Leadership
- Mapping of SDG targets to scheme/programmes/policies
- Coordination with central ministries
- Coordination with State Planning Departments
- Developing monitoring framework and capacities
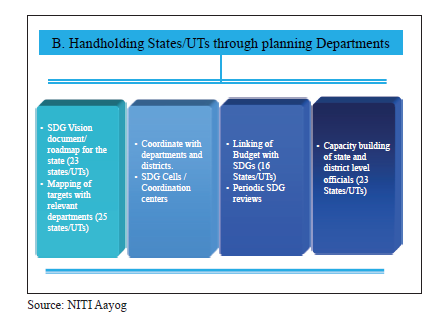
State Level Leadership
- SDG Vision document/roadmap for the state
- Mapping of targets with relevant departments
- Coordinate with department and districts
- Linking of Budget with SDGs
Climate Change
- Proactive climate actions by India
- Nationally Determined Contribution (NDC)
- To reduce the emissions intensity of its GDP by 33 to 35 per cent below 2005 levels by the year 2030
- Achieve 40 per cent of cumulative electric power installed capacity from non-fossil fuel sources by 2030
- Enhance forest and tree cover to create additional carbon sink equivalent to 2.5 to 3 billion tons of carbon dioxide by 2030
National Action Plan on Climate Change (NAPCC)
- It was launched in 2008 with 8 National Missions.
- National Solar Mission (NSM): To achieve 100 GW of solar power in seven years starting from 2014-
- National Mission for Enhanced Energy Efficiency (NMEEE)
- Mandating reduction in energy consumption in large energy consuming industries.
- Financing for PPP to reduce energy consumption through demand-side management programs in the municipal, buildings, and agricultural sectors.
- Energy incentives, including reduced taxes on energy-efficient appliances.
- The Perform Achieve and Trade (PAT) Scheme is one of the initiatives under the NMEEE, and was initiated in March 2012.
National Mission for a Green India (GIM):
Improved ecosystem services by Increasing forest/tree cover by 5 m ha and improving quality of forest cover on another 5 m ha (a total of 10 m ha).
National Mission on Sustainable Habitat (NMSH)
- Development of sustainable habitat standards.
- Promoting energy efficiency as a core component of urban planning by extending the existing Energy Conservation Building Code (ECBC).
- Strengthening the enforcement of automotive fuel economy standards.
- The mission is being implemented through three programmes: Atal Mission on Rejuvenation and Urban Transformation, Swachh Bharat Mission, and Smart Cities Mission.
National Water Mission (NWM): Focuses on monitoring of ground water, aquifer mapping, capacity building, water quality monitoring and other baseline studies.
National Mission for Sustainable Agriculture: Enhancing food security by making agriculture more productive, sustainable, remunerative, and climate resilient.
National Mission for Sustaining Himalayan Ecosystems:
To continuously assess the health status of the Himalayan Ecosystem. The key achievements include
- Setting up of the Centre of Glaciology at Wadia Institute of Himalayan Geology.
- A mega programme named Human and Institutional Capacity Building (HICAB) programme for the Indian Himalayan Region was launched during the 2018-19 and six state level knowledge networks have been supported in the states of Jammu & Kashmir, Himachal Pradesh, Assam,
- Meghalaya, Manipur and Arunachal Pradesh in the Himalayan Region.
National Mission on Strategic Knowledge for Climate Change (NMSKCC):
- To gain a better understanding of climate science, formation of knowledge networks among the existing knowledge institutions engaged in research and development.
Jawaharlal Nehru National Solar Mission (JNNSM)
- It was launched in 2010 with the aim to:
- deploy 20,000 MW of grid connected solar power by 2022 to be achieved in 3 phases
- 2,000 MW of off -grid solar applications including 20 million solar lights by 2022
- 20 million sq. m. solar thermal collector area
Climate Change Action Plan (CCAP)
- It is a Central Sector Scheme which was approved in January 2014.
- It was formed to build and support the scientific and analytical capacity for assessment of climate change in the country.
- Two important components of the CCAP scheme are the National Carbonaceous Aerosols Program (NCAP) and the Long-Term Ecological Observatories (LTEO).
National Adaptation Fund on Climate Change (NAFCC)
- It is a Central Sector Scheme with National Bank for Agriculture and Rural Development (NABARD) as the National Implementing Entity.
- It was operationalized in 2015-16.
- FAME India
- The Government is implementing Faster Adoption and Manufacturing of (Hybrid&) Electric Vehicle in India (FAME India) scheme.
- It was started in 2015
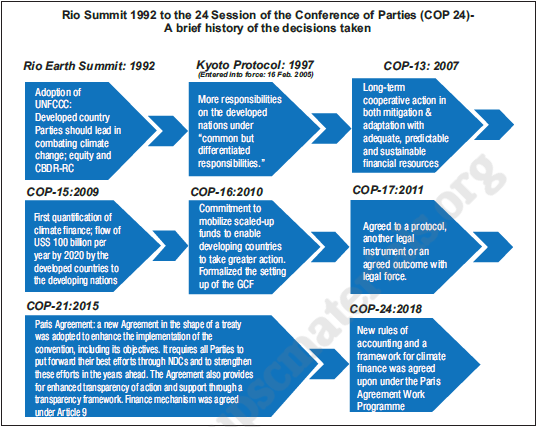
Paris Agreement
- The Paris Agreement was adopted under UNFCCC in December 2015 to enhance the implementation of the Convention.
- Its central aim is to keep the global temperature rise this century to well below 2 degrees celsius above pre-industrial levels and to pursue efforts to limit the temperature increase even further to 1.5 degrees celsius.
- 25th Session of the Conference of Parties (COP 25)
- The COP 25 decision text titled ‘Chile Madrid Time for Action’.
- It recognized the urgent need to enhance the provision of support to the developing country Parties to enable them to strengthen their national adaptation and mitigation efforts.
- The decision also recalled the commitment made by the developed country Parties to the goal of mobilizing jointly US$ 100 billion per year by 2020 to address the needs of the developing country Parties.
Conference of Parties (COP 26) and Post 2020 Issues
- COP 26 and the preceding UNFCCC subsidiary bodies’ sessions have now been postponed.
- Augmenting Finance For Sustainable Development
These include the following:
- National Voluntary Guidelines for Responsible Financing was finalized in 2015.
- In 2015, the RBI included lending to social infrastructure and small renewable energy projects within the priority sector targets.
- In September 2020, the loan limits for renewable energy were doubled to 30 crores and for individual households, the renewable energy loan limit is 10 lakhs per borrower.
- The ‘Voluntary Guidelines on Corporate Social Responsibility’ were issued in 2009 to mainstream the concept of business responsibility.
- Capital market products such as Green Bonds or Social Impact Bonds.
- SEBI constituted a Working Group (WG) on Social Stock Exchanges in September 2019.
- India joined the European Commission-led International Platform on Sustainable Finance (IPSF) in October 2019 as one of the founding members.
- Investing in Resilience for Sustainable Development
- Climate Risk Insurance is an important tool
India’s Initiatives at the International Stage
- International Solar Alliance (ISA): It has recently launched two new initiatives – a ‘World Solar Bank’ and ‘One Sun S One World One Grid Initiative’.
- The proposed World Solar Bank would cater to the need for dedicated financing window.
- The ‘One Sun One World One Grid’ aims to create an interconnected green grid that will enable solar energy generation in regions with high potential and facilitate its evacuation to demand centers.
- Coalition for Disaster Resilient Infrastructure
- It was launched in September 2019 at the UN Climate Action Summit.
- The Coalition functions as an inclusive multi-stakeholder platform led and managed by national governments. The CDRI is co-chaired by India and the United Kingdom (UK).
Conclusion and Way Forward
- India’s endeavour is to ensure a robust growth and a sustainable development path while combating the climate change risks on best effort basis.
- As per the second BUR submitted to UNFCCC in 2018, India’s emission intensity of GDP reduced by 21 per cent in 2014 over the level of 2005. India has also leapfrogged from BS-IV to BS-VI emission norms on 1st April, 2020, earlier than the initial date for adoption in 2024. By 2020, the developed country partners had to fulfill the promised support of US$ 100 billion per year in the form of climate finance to the developing nations. This has not happened.
- The lack of required momentum in the scope, scale and speed of climate finance from developed to developing countries needs to be addressed.
CHAPTER – 7
“Agriculture and Food Management”
Introduction
- Amid influence of COVID-19 pandemic across different sectors of economy the globe and India , the farming activities were also influenced negatively as the movement of farm inputs including farm machinery from one location to other were ceased.
- The national lockdown coincided with the commencement of the harvesting season for the Rabi crops which further created adversity for the sector.
- Migration of agricultural labourers to their native places during the lockdown created a shortage of farm labourers mainly in states like Haryana, Punjab and Tamil Nadu.
- Despite all these adversities, India’s agricultural system demonstrated its resilience despite slide in performance of other sectors.
- Apart from clocking a growth rate of 3.4 percent at constant prices during 2020-21, it also maintained continuous supply of agriculture commodities, especially staples like rice, wheat, pulses and vegetables and thus enabled food security.
- In order to further strengthen and support the agricultural sector, several initiatives have been taken by the Government of India under the Atma Nirbhar Bharat Abhiyan.
Aatma Nirbhar Bharat Abhiyan and Agriculture sector in India
- Amid pursuance of self-reliant India in times of Pandemic, government announced different packages for different sectors of economy.
- Agri Infrastructure Fund: Government has provided 1 lakh crore rupees for setting up this fund for financing agriculture infrastructure projects at farm-gate & at aggregation points and for financially viable post-harvest management infrastructure.
- Scheme for Formalisation of Micro Food Enterprises (MFE): Under Aatmanirbhar Bharat Abhiyan Initiaitve, government has provided Rs. 10000 cr for scheme for Formalisation of Micro Food Enterprises (MFE). It will aid 2 lakh MFEs who need technical upgradation to attain FSSAI food standards, build brands and support marketing.
- Pradhan Mantri Matsya Sampada Yojana (PMMSY): The initiative has allocated Rs. 20000 cr for Pradhan Mantri Matsya Sampada Yojana. It aims at integrated, sustainable and inclusive development of marine and inland fisheries by developing infrastructure such as fishing harbours, cold chain, markets, etc.
National Animal Disease Control Programme: It aims to targets Foot and Mouth Disease (FMD) and Brucellosis by ensuring 100 per cent vaccination of cattle, buffalo, sheep, goat and pig population.
- Animal Husbandry Infrastructure Development Fund: This fund has been allocated Rs.15000 crore which aims to support private investment in dairy processing, enable value addition and improved cattle feed infrastructure.
- Operation Greens: “Operation Greens” which is run by Ministry of Food Processing Industries (MOFPI) has been extended from tomatoes, onion and potatoes to ALL fruit and vegetables.
- Food Security: The government launched PM Garib Kalyan Ann Yojana ensures food and nutritional security to all during the time of pandemic.
- One Nation One Ration Card Scheme: The Scheme aims to help migrant workers to access PDS benefits from any fair price shop in the country.
Performance of the agriculture sector in last fiscal year
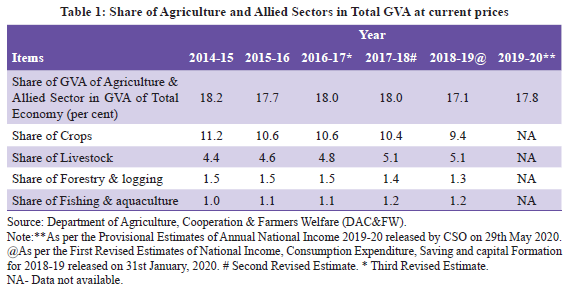
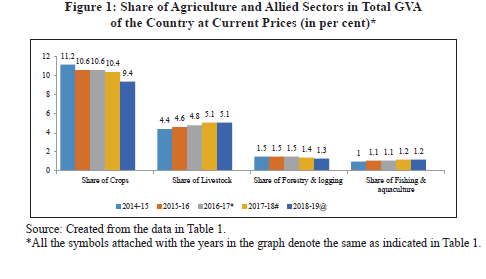
- Share in GVA: The share of agriculture and allied sectors in GVA of the country has declined from 18.2 per cent in 2014-15 to 17.8 per cent in 2019-20. It is an inevitable outcome of a development process in which the relative performance of non-agricultural sectors becomes more dominant.
- Growth in Agriculture & Allied Sectors: During 2020-21, while the GVA for the entire economy contracted by 7.2 percent, growth in GVA for agriculture maintained a positive growth of 3.4percent.
- Gross Capital Formation: Gross Capital Formation (GCF) in the agriculture and allied sector as a proportion to GVA has been showing a fluctuating trend from 17.7 per cent in 2013-14 to 16.4 per cent in 2018-19, with a dip to 14.7 per cent in 2015-16.
- Production of Crops: Total food grain production in the country is estimated at record 296.65 million tonnes which is higher by 11.44 million tonnes than the production of food grain during last fiscal year. It is also higher than average of last five year of agriculture production.
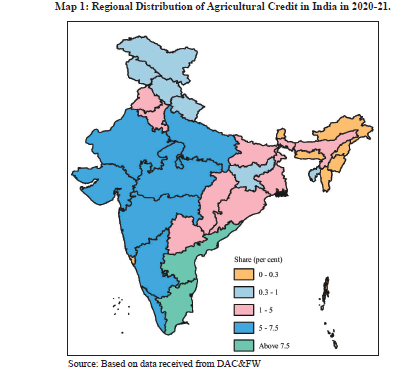
- Agricultural Credit: The agriculture credit fl ow target for 2020-21 was fixed at Rs. 15,00,000 crores and till 30th November, 2020 a sum of Rs. 9,73,517.80 crores was disbursed. The Agriculture Infrastructure Fund will further boost credit flow to the agriculture sector.
- International Trade in Agricultural Commodities: India’s agricultural and allied exports amounted to approximately Rs. 252 thousand crores with major export destinations were USA, Saudi Arabia, Iran, Nepal and Bangladesh.
- Marine products, basmati rice, buffalo meat, spices, non-basmati rice, cotton raw, oil meals, sugar, castor oil and tea were the top agriculture and related products exported from India.
- India’s total agri-export basket accounts for a little over 2.5 percent of world agri-trade which is very less owing to heavy demands of Indian agriculture products.
- Minimum Support Price
- Kharif Crops: Government had announced the increase in MSP for kharif crops for marketing season 2020-21. The highest increase in MSP announced is for niger seed (Rs. 755 per quintal) followed by sesamum (Rs. 370 per quintal), urad (Rs. 300 per quintal) and cotton (long staple) (Rs. 275 per quintal).
- Rabi Crops: The highest increase in MSP has been announced for lentil (Rs. 300 per quintal) followed by gram and rapeseed & mustard (Rs.225 per quintal each) and safflower (Rs.112 per quintal). For barley and wheat, an increase of Rs. 75 per quintal and ` 50 per quintal respectively has been announced.
- Crop Insurance: The average sum insured per hectare has increased from Rs 15,100 during the pre- PMFBY Schemes to Rs. 40,700 under Pradhan Mantri Fasal Bima Yojana (PMFBY)
- The Scheme has covered over 5.5 crore farmer applications year on year. As on 12th January, 2021, claims worth Rs. 90,000 crores have already been paid out under the Scheme.
- During COVID lock down period nearly 70 lakh farmers benefitted and claims worth Rs. 8741.30 crores were transferred to the beneficiaries.
PM-KISAN
- The Pradhan Mantri Kisan Samman Nidhi (PM-KISAN) Scheme was launched in 2019 to provide income support to all landholder farmer families across the country with cultivable land.
- Under the Scheme, an amount of Rs. 6000 per year is released in three installments of Rs. 2000 each directly into the bank accounts of the beneficiaries.
- More than Rs. 1.10 lakh crore have reached the account of farmers after 7th round of installment under the scheme.
Allied Sectors: Animal Husbandry, Dairying & Fisheries
- Performance: This sector had grown at CAGR of 8.24 per cent during 2014-15 to 2018-19.
- The contribution of livestock in total agriculture and allied sector GVA(at constant prices) has increased from 24.32 per cent (2014-15) to 28.63 per cent (2018-19).
- Livestock sector alone has contributed 4.2 per cent of total GVA in 2018-19.
Milk Production
- India continues to be the largest producer of milk in the world. Milk production in the country has increased from 146.3 million tonnes in 2014-15 to 198.4 million tonnes in 2019-20.
- In 2019-20, milk production increased by 5.68 percent as compared to the previous year and per capita availability of milk was 407 grams per day.
Livestock Population and Production
- According to FAOSTAT production data (2019), India ranks 3rd in egg production in the world.
- In the egg production with 10.19 per cent growth has been registered in 2019-20.
- The per capita availability of egg was 86 eggs per annum in 2019-20. It has been achieved due to a quantum leap in the last four decades e to technological support and commercial production.
Agricultural Research And Education
- Indian Council of Agricultural Research (ICAR) has taken a number of initiatives in this field.
- A total of 172 new varieties/hybrids of field crops and 75 horticultural crops were notified/released till October, 2020.
- The Council had also developed 17 bio fortified varieties of field and horticulture crops to ensure nutritional security through the natural food system. It has taken the tally of bio fortified varieties to 71.
Natural Resource Management and Integrated Farming
- Bio-intensive cropping systems having higher productivity potential for different agro-climatic zones have been developed by ICAR.
- It has also developed developed 60 location specific, cost effective, eco-friendly, socially acceptable multi-enterprise Integrated Farming System (IFS) models.
- Bio-intensive cropping systems having higher productivity potential for different agro-climatic zones have been included in the crop production process.
- Climate Resilient Technologies have been developed in order to increase the productivity of agriculture while giving equal importance to fi sheries and livestocks.
- Krishi Vigyan Kendras (KVKs) have organized 1644 training programmes on climate resilient agriculture involving 42655 farmers.
- Mechanization and Crop Residue Management and Reaching to the Farmers and Youth with Improved
- Technologies have been done by Krishi Vigyan Kendras at signifi cant level.
Food Processing Sector
- In the last 5 years ending 2018-19, food processing industries (FPI) has been growing at an average annual growth rate of around 9.99 per cent as compared to around 3.12 percent in agriculture and 8.25 per cent in manufacturing at 2011-12 prices.
The sector constitutes
- New Initiatives in Food Processing Sector
- Formalization of Micro Food Processing Enterprises
- It is a Centrally Sponsored Scheme launched under Atma Nirbhar Bharat Abhiyan by Ministry of Food Processing Industries (MoFPI).
- It is expected to benefit 2 lakh micro food processing units through credit linked subsidy.
- One District One Product (ODOP) approach has been adopted by government to reap benefit of scale in terms of procurement of inputs, availing common services and marketing of products.
- The States need to identify one food product per district keeping in view the existing clusters and availability of raw material, under the scheme.
- The scheme focuses specially on waste to wealth products, minor forest products and Aspirational Districts.
Production-Linked Incentive (PLI) Scheme
- The Production-Linked Incentive (PLI) Scheme has been approved in 10 key sectors, including food processing sector, for enhancing India’s manufacturing capabilities and improving exports.
- The scheme supports ready to eat/ready to cook, marine products, processed fruits & vegetables, mozzarella cheese, and innovative/organic products of SMEs.
- It will also promote marketing and branding of agricultural produce abroad.
Food Management
- Fortification of Rice and Its Distribution
- To address the issue of anemia and micro-nutrient deficiency and to promote nutrition security in the country, a centrally sponsored pilot scheme on “Fortification of Rice & its Distribution under Public Distribution System” was approved for a period of 3 years beginning in 2019-20
- In the pilot phase, the scheme will focus on 15 Districts each from every states in India.
Conclusion:
- Agriculture sector in India performed well in last financial year despite COVID-19 pandemic. Government has also taken a large number of initiatives to secure production, distribution, processing and storage of agricultural commodities. These steps of government will help India to double the farmer’s income by 2022 and agricultural export. Further, it will also help India to ensure food security to its citizens and achieve sustainable development goals such as SDG 1 (No Poverty) and SDG2 (Zero Hunger).
CHAPTER – 8
“Industry and Infrastructure”
Introduction
- The financial year 2020-21 (FY21) began amidst a global pandemic, the management of which led to countries adopting unprecedented measures that brought the economy to a grinding halt.
- The rebuilding of the Indian economy is hinged on various reform measures aimed at addressing concerns of businesses and support to livelihoods.
- India implemented policies aimed at reducing transaction costs, supporting Micro Small and Medium Enterprises (MSMEs), enhancing competition, fostering employment creation and securing sustenance through the Atmanirbhar Bharat Abhiyan.
- The performance of the industrial sector is critical given its deep backward and forward linkages with the other sectors of the economy.
Assessing the trends/performance in industrial sector
- Index of Eight-Core Industries and Index of Industrial Production (IIP)
- The eight-core industries that support infrastructure, such as coal, crude oil, natural gas, refinery products, fertilizers, steel, cement, and electricity have a total weight of nearly 40 percent in the IIP.
- The eight-core index recorded its all-time low growth of (-) 37.9 due to covid-19 led nation-wide lockdown (April-2020).
- The eight-core industries registered (-) 2.6 per cent growth in November-2020 as compared to 0.7 per cent in November-2019 and (-) 0.9 per cent in October-2020.
- The cumulative growth of core industries during April-November 2020 was (-) 11.4 per cent as compared to 0.3 per cent during April-November 2019.
Analysis of IIP by weight of items
- To provide another perspective on the revival of growth, the IIP was further analysed by the weight of items that have recorded growth.
- The weight of the items that recorded growth was 46.05 per cent in November-2020, which was significantly higher than 5.87 per cent in the month of April-2020.
- In the past (from Apr-12 to Feb-20), the number of items that recorded a monthly growth in the pre- COVID-19 regime had an average weight of 61.6 per cent.
- The weight of the items recording positive growth in November-2019 and November-2018 were 22 per cent and 52.40 per cent, respectively.
Gross Capital Formation in the Industrial Sector
- The rate of growth of Gross Capital Formation (GCF) in industry registered a sharp rise from 1.2 per cent in FY18 to 17.5 per cent in FY19, showing a substantive improvement in GCF in the sector.
- Mining & Quarrying, Manufacturing, ‘Electricity, Gas, Water Supply & Other Utility Services’ and Construction had registered a growth rate of 14.9 per cent, 15.9 per cent, 15.3 per cent, and 24.4 per cent respectively in FY19.
- However, the share of GCF of the industrial sector had declined from 38.2 per cent in FY12 to 30.2 per cent of GDP in FY18 before an uptick (31.9 per cent) was recorded in FY19.
Credit to the Industrial Sector
- Gross bank credit to the industrial sector, on a YoY basis, recorded (-) 1.7 growth in October-2020 as compared to 3.4 per cent growth in October-2019.
- Some of the industries recorded a nominal credit growth including the construction sectors.
- The laggards in the group are ‘All Engineering’, ‘Cement & Cement Products’, and ‘Basic Metal & Metal Products’ which recorded a YoY negative growth in October-2020.
- Performance of Central Public Sector Enterprises (CPSEs)
- CPSEs
- CPSEs are operating in 4 sectors –Agriculture, Mining & Exploration, Manufacturing, and Services.
- As of January 15, 2021, based on provisional information with Department of Public Enterprises, there are 366 CPSEs as of March 2020.
- Of these, 256 are in operation, but only 171 CPSEs booked profit during FY20.
Ease of Doing Business
- As per the Doing Business Report (DBR), 2020, the rank of India in the Ease of Doing Business (EoDB) Index for 2019 has moved upwards to the 63rd position amongst 190 countries from a rank of 77 in 2018.
- As per the DBR 2020 report:
- Lead subcomponents of EoDB were ‘getting electricity’, ‘trading across borders’ and others
- Main laggards were ‘enforcing contracts’, ‘registering property’, ‘revoking insolvency’, and ‘pay taxes’.
Start-up India
- To facilitate the growth of startups, GoI had announced the “Startup India, Stand-up India” initiative.
- As on December 23, 2020, GoI has recognized a total of 41061 startups and 4,70,000 jobs have been reported by more than 39,000 startups.
- The Government has taken several initiatives to promote the startups:
- Startups Intellectual Property Protection (SIPP) scheme enables a start-up to seek assistance from any empanelled facilitator to file and prosecute their application.
- The Fund of Funds for Startups (FFS) with a total corpus of Rs. 10,000 crores was established with contribution spread over the 14th and 15th Finance Commission cycle based on the progress of implementation.
- Startup Yatra: An initiative that include travelling to Tier 2 and
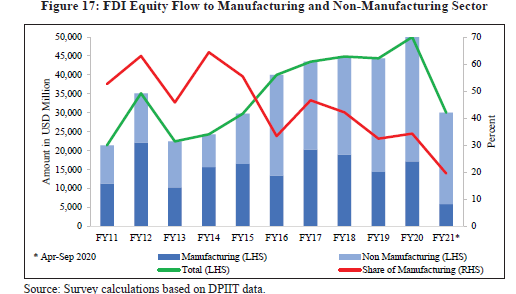
Foreign Direct Investment (FDI)
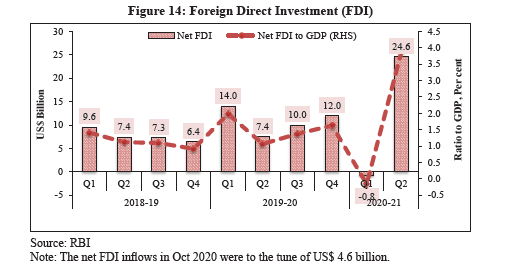
- During FY20, total FDI equity inflows were US$49.98 billion as compared to US$44.37 billion during FY19.
- The similar number for FY21 (up to September-2020) was US$30.0 billion.
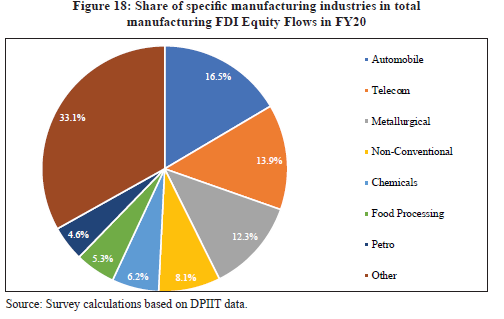
- The bulk of FDI equity flow is in the non-manufacturing sector leading to a reduction in the share of manufacturing in the FDI flows.
- Within the manufacturing sector, industries like automobile, telecommunication, metallurgical, nonconventional energy, chemical (other than fertilizers), food processing, and petroleum & natural gas get the bulk of FDI equity flows.
- These industries together accounted for about 67 per cent of FDI equity flows into the manufacturing sector in FY20.
Sector Wise Issues and Initiatives
Steel
- Current Status
- India is the second-largest producer of crude steel only after China.
- India is also the second largest consumer of steel.
- However, its per capita total finished steel consumption was around 74.7 kg during FY20 as against the global average of 229 kg.
- Further, the capacity utilization in crude steel plants continues to be low.
Government initiatives
- The National Steel Policy, 2017 (NSP-17) aims at achieving a crude steel capacity of 300 million tonnes (MT) and a finished steel capacity of 230 MT with a per capita consumption of 158 kg by 2030- 31.
- Recently, the GoI has taken various initiatives under the Atmanirbhar Abhiyan to enhance the domestic production of steel such as inclusion of ‘Speciality Steel’ under the Production Linked Incentive (PLI) scheme protecting the industry from unfair trade through appropriate remedial measures
Coal
- Current status
- Coal accounts for 55 per cent of the country’s energy needs.
- India is also an importer of coal, importing 248.54 MT of coal in FY20, a growth of 5.7 per cent over FY19.
- In the FY20, the production of raw coal in India was 729.1 million tonnes (MnT) with a minuscule growth of 0.05 per cent over the previous year.
- In FY21 (April-October), all India coal production was 337.52 MnT, thus declining by 3.3 per cent YoY. The contraction in production is attributable to COVID-19.
Government initiatives
- Creating carbon sink: About 54500 ha land has been brought under green cover by planting 132 million trees – estimated carbon sink of 2.7 lakh tonnes of CO2 equivalent/year.
- Two Coal Bed Methane (CBM) Projects with considerable potential for carbon footprint reduction are in the pipeline
- Several amendments were brought into the Coal Mines (Special Provisions) Act, 2015 through the Mineral Laws (Amendment) Act, 2020 enacted on 13.03.2020.
Micro, Small & Medium Enterprises (MSME)
Current status
- Total MSMEs: more than 6 crores
- Employment generation: more than 11 crores people
- GDP: 30 per cent to the GDP.
- Corrective and supportive measures
- Several corrective and supportive measures have been taken to bring the sector on track. The first among those is the revision of the investment criteria in the MSME definition.
other interventions have also been taken like the
- Champions Portal
- Udyam registration portal
- Textile and Apparels
- Current Status
- GDP: 2 per cent in the overall GDP
- Total manufacturing GVA: 11 per cent
- Total direct and indirect employment: 10.5 crore people. The sector is the second-largest employment generator in the country, next only to agriculture.
- India is the sixth-largest exporter of textile and apparel products after China, Germany, Bangladesh, Vietnam, and Italy.
Government measures
- Amended Technology Upgradation Fund Scheme (ATUFS): to modernize and upgrade the technology of the Indian textile industry.
- Scheme for Integrated textiles park (SITP): to provide world class infrastructure facilities
- Samarth: focuses on capacity building in the textile sector
- Infrastructure
- Government measures
- National Infrastructure Pipeline (NIP) for the FY 2020-2025 to facilitated world class infrastructure projects to be implemented.
- The GoI set up the Public Private Partnership Appraisal Committee (PPPAC) responsible for the appraisal of PPP projects in the Central sector.
- In FY21, the GoI approved the continuation of the revamped Infrastructure Viability Gap Funding (VGF) scheme till 2024-25.
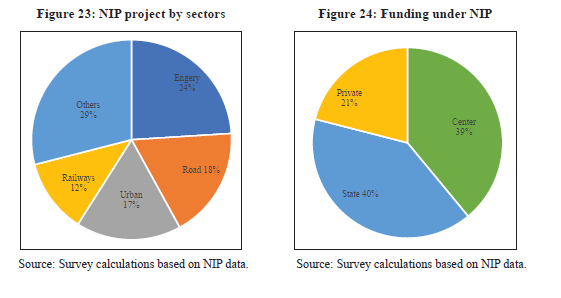
Road Sector
- Current status
- GVA (FY19): 4.6 per cent of which the share of road transport contributed roughly 67 per cent
- With 63.86 lakh kms of rural-urban roads and national-state highways, India is next only to the United States of America that has a road network of 66.45 lakh km.
- During the decade ending in FY19, the national highways recorded a CAGR of 7.25 per cent followed by rural roads (6.25 per cent) and urban roads (4.27 per cent).
Civil Aviation
- India’s domestic traffic has more than doubled from around 61 million in FY14 to around 137 million in FY20, a growth of over 14 per cent per annum.
- From the third largest domestic aviation market, it is expected to become the third largest overall(including domestic and international traffic) by the year FY25.
Port and Shipping
- Current status
- In India, around 95 per cent (68 percent) of total volume (value) of international trade is transported by sea.
- India is endowed with a rich coastline of 7500 km and has a strategic location on key international maritime trade routes.
Government Schemes
- Sagarmala Programme: to promote port-led development in the country and reduce logistics costs for trade.
- Railways
- Current Status
- Indian Railways (IR) with over 67,580 route kms, is the third-largest network in the world under single management.
- During the FY20, IR carried 1.2 billion tonnes of freight and 8.1 billion passengers – making it the world’s largest passenger carrier and fourth-largest freight carrier.
- Revenue earning freight loading (excluding loading by Konkan Railway) by IR in FY20 was 12,084 lakh tonnes, registering a decrease of 1.1 per cent over FY19.
- The passenger traffic was 80,857 lakhs in FY20 registering a growth of (-) 4.2 per cent over FY19.
- Government Schemes
- Privatization: The GoI has allowed the private players to operate in the Railways sector through the PPP mode under the “New India New Railway” initiative.
- Kisan Rail Services: The Union Budget 2020-21 made an announcement to run the Kisan Rail services to provide better market opportunity by transporting perishables and agri-product, including milk, meat, and fi sh.
- National Rail Plan (NRP): To develop capacity- both infrastructure and rolling stock- ahead of demand, the Ministry of Railways has developed a National Rail Plan (NRP).
Campaigns/programmes
- The IR launched a special cleanliness campaign under Swachh bharat Abhiyan on 2nd October 2014.
- Under the cleanliness campaign, the IR has installed the bio-toilets in all passenger coaches.
Telecom Sector
- Current status
- The telecom sector plays an important role in implementation of JAM-trinity (Jandhan Aadhar Mobile) based social sector schemes and other pro-development initiative of the GoI.
- The wireless telephony constitutes 98.3 per cent of all subscriptions whereas the share of landline telephones now stands at only 1.7 per cent.
- The overall tele density in India stands at 86.6 per cent at the end of November-2020, whereas tele density in rural and urban areas are 59.1 per cent and 139.0 per cent respectively.
- The number of internet subscribers (both broadband and narrowband put together) stood at 776.45 million at the end of September-2020 as compared to 636.73 million in March-2019.
Government Schemes
- BharatNet for achieving the goal of Digital India programme.
- Broadband connectivity: The GoI has laid considerable emphasis on broadband for all as a part of its Digital India Campaign.
- Petroleum and Natural Gas
Current status
- India is the third-largest energy consumer in the world after USA and China.
- With a share of 5.8 per cent of the world’s primary energy consumption, the Indian energy consumption basket is primarily dominated by Coal and Crude Oil.
- India’s indigenous crude oil production declined to 32.17 Million Metric Tonnes (MMT) in FY20 as against 34.20 MMT in FY19.
- Of the total crude oil & condensate production, 64.1 per cent was from ONGC, 9.7 per cent from OIL, and 26.2 per cent from the Production Share Contract (PSC) regime.
Power
- The total installed capacity has increased from 3,56,100 MW in March-2019 to 3,70,106 MW in March 2020.
- Further, the generation capacity increased to 3,73,436 MW in October-2020 and comprised of 2,31,321 MW 300 of thermal, 45,699 MW of hydro, 6,780 MW of nuclear, and 89,636 MW of renewables and others.
- The capacity addition in the power sector was mainly driven by the Government in the year FY20.
- The energy intensity of India (at 2011-12 prices) decreased from 65.6 toes per crore rupees in FY12 to 43 toe per crore rupees in FY19.
- Further, the country has already accomplished two major landmarks in rural electrification arena:
- 100 per cent village electrifi cation under Deen Dayal Upadhyaya Gram Joyti Yojana
- universal household electrifi cation under ‘Pradhan Mantri Sahaj Bijli Har Ghar Yojana’ (Saubhaagya)
Mining Sector
- The Gross Value Added (GVA) of the mining and quarrying sector in FY20 was ` 3,93,102 crores (at current price), accounting for about 2.1 per cent of the overall GVA during FY20.
- The production value of the major minerals increased by 2.3 per cent in FY20 as compared to 22.4 per cent growth in FY19.
Housing and Urban Infrastructure
- India is witnessing rapid urbanisation. According to Census 2011, India’s urban population was 37.7 crores, which is projected to grow to about 60 crores by 2030.
- The GoI has been implementing the Deendayal Antyodaya Yojana – National Urban Livelihoods Mission in all the statutory towns to address the social & occupational vulnerabilities of the urban poor.
- PM Street Vendor’s Atmanirbhar Nidhi (PM SVANidhi) for providing micro-credit facility to the street vendors to restart their businesses post COVID-19 lockdowns.
- Pradhan Mantri Awas Yojan-Urban (PMAY-U) has been rapidly moving towards achieving the vision for providing a pucca house to every household by 2022.
- Light House Projects (LHPs): To provide impetus to innovative technology for housing construction, Prime Minister laid foundation stones of Light House Projects (LHPs) on 1st January, 2021.
Way Forward
- The year after the crisis (FY22) will require sustained and calibrated measures to facilitate the process of economic recovery and to enable the economy to get back to its long-term growth trajectory. The revival of the industrial and infrastructure sector will be key to overall economic growth and macroeconomic stability.
CHAPTER – 9
“Services”
Services Sector Performance In India: An Overview
- The COVID-19 pandemic, the subsequent lockdown and social distancing measures have had a significant impact on the contact-intensive services sector.
- Air passenger traffic, rail freight traffic, port traffic, foreign tourist arrivals, and foreign exchange earnings all contracted sharply following the first lockdown which was announced in March, 2020.
- Services sector’s significance in the Indian economy has been steady, with the sector now accounting for over 54 per cent of the economy and almost four-fifths of total FDI inflows.
Impact of COVID-19 on Services Sector
- The contact intensive services sector was severely impacted, particularly sub-sectors such as tourism, aviation, and hospitality. The first half of FY 2020-21 saw services sector contract by almost 16 percent.
- ‘Trade, hotels, transport, communication & broadcasting services’, ‘Financial, real estate & professional services’, and ‘Public administration, defence & other services’ are estimated to contract by 21.41 per cent, 3.68 per cent and 0.82 per cent respectively.
- Rail freight traffic growth nosedived to (-) 35.3 per cent YoY in April 2020 before rising back sharply to 15.5 per cent YoY in September 2020.
- The domestic air traffic, however, stands 50.93 per cent lower in November 2020 as compared to November 2019.
- Strong bank credit growth in 2020 as compared to 2019 driven by sectors like ‘Tourism, Hotels &
- Restaurants’, ‘Transport Operators’, and ‘Other Services’. However, bank credit growth to ‘Professional Services’ and ‘Shipping’ contracted.
- Service sector share at the State and UT level
- The services sector accounts for more than 50 per cent of the Gross State Value Added (GSVA) in 15 out of the 33 states and UTs.
- In eight states, services sector accounts for more than 60 per cent of GSVA. Chandigarh and Delhi stand out with a particularly high share of services in GSVA of over 85 per cent while Sikkim’s share remains the lowest at 27.02 per cent.
FDI Inflows into Services Sector
- India improved its position from 12th in 2018 to 9th in 2019 in the list of the world’s largest FDI recipients according to the latest World Investment Report 2020 by United Nations Conference on Trade and Development (UNCTAD).
- FDI into India recorded almost 17 per cent jump during April-September 2020 over the corresponding period last year, despite the global slowdown due to COVID-19.
- Services sector, being the largest recipient of FDI in India, witnessed a strong growth during April- September 2020.
- The jump in FDI equity inflows was driven by strong inflows into the ‘Computer Software & Hardware’ sub-sector, wherein FDI inflows increased to US$ 17.55 billion which is over 336 per cent higher over the corresponding period last year.
Trade in Services Sector
- India has a significant presence in the services sector exports. It remained among the top ten trading countries in commercial services in 2019 accounting for 3.5 per cent of world services exports. Net services export receipts amounted to US$ 41.67 billion in H1 of FY2020-21 as compared with US$ 40.47 billion a year ago.
- Software exports, with a share of 49.3 per cent in total services exports, however, remained resilient with higher demand for digital support, cloud services and infrastructure modernisation catering to the new challenges posed by the pandemic.
- Sharper decline in services imports over exports led to an increase in net services receipts by 2.1 per cent in Q1 of 2020-21 over the previous year.
Major Services: Sub-Sector Wise Performance and Recent Policies
Tourism Sector:
- As per the World Tourism Barometer of the United Nation’s World Tourism Organization (December, 2020 edition), international arrivals fell by 72 per cent globally over the first ten months of 2020, with restrictions on travel, low consumer confidence and a global struggle to contain the COVID-19 virus, all contributing to the worst year on record in the history of tourism.
- Foreign tourists from the top 10 countries visiting India are from Bangladesh, USA, UK, Australia, Canada, China, Malaysia, Sri Lanka, Germany and Russia. They accounted for 67 per cent of the total foreign tourist arrivals in India in 2019.
- Tourism contributed 5 per cent share to India’s total GDP in 2018-19. It also supports almost 13 per cent of total employment in India. With the ongoing vaccination drive, the contact intensive service sectors can expect to witness revival
Information Technology-Business process management (IT-BPM) Services
- Over the last decade, the industry grew by 102 per cent reaching US$ 190.5 billion in revenues in 2019-20. It also added 1.8 million employees, up 70 per cent over the last 10 years.
- USA remained the biggest recipient of exports, followed by the UK.
- In 2021, a number of significant structural reforms have been undertaken to drive innovation, technology adoption and efficiency in the IT-BPM sector, including Relaxation of OSP Terms & Conditions, and Consumer Protection (E-commerce) Rules, 2020.
Ports, Shipping and Waterways Services
- Ports handle around 90 per cent of export-import cargo by volume and 70 per cent by value in India.
- A consistent growth of around 6 per cent was maintained in overall port traffic between 2015-16 and 2018-19. It decelerated to 1.98 per cent in 2019-20 before falling sharply in 2020 owning to the lockdown in the wake of COVID-19 pandemic.
- The turnaround time of ships, which is a key indicator of efficiency of the ports sector, has declined from 4 days in 2014-15 to 2.62 days in 2020-21.
- To harness the coastline, 14,500 km of potentially navigable waterways and strategic location on key international maritime trade routes, the Government has embarked on the ambitious Sagarmala Programme to promote port-led development in the country.
- This includes reducing the cost of transporting domestic cargo; lowering logistical cost of bulk commodities by locating future industrial capacities near the coast; improving export competitiveness by developing port proximate discrete manufacturing clusters, etc.
Space Sector
- India spent about US$ 1.8 billion on space programmes in 2019-20. However, the country still lags behind the major players in the space sector, such as USA.
- The commercial satellite industry is accounting for nearly 75 per cent of global space business.
- Technology innovations and demand drives the need for higher bandwidth capacity, throughput speeds, improved optical, radar and thermal imaging. PwC estimates that the Indian space economy is valued at US$ 7 billion, which is around 2 per cent of the global space economy.
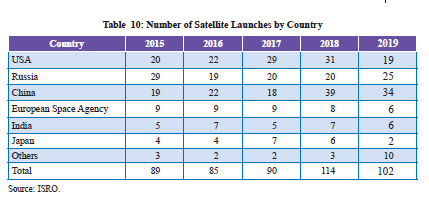
Chapter at a Glance
- India’s Services sector witnessed a significant set-back during the COVID-19 pandemic mandated lockdown. Owing to its contact-intensive nature, the sector contracted by nearly 16 per cent during the first half of the financial year 2020-21.
- Air passenger traffic, rail freight traffic, port traffic, foreign tourist arrivals, and foreign exchange all contracted sharply as soon as the first lockdown was announced in March 2020. However, there are now signs of steady recovery.
- Despite the disruptions being witnessed globally, FDI inflows into India’s services sector grew robustly by 34 percent YoY during April-September 2020 to reach US$ 23.6 billion.
- The year 2020-21 witnessed many significant structural reforms. Telecom related regulations were removed from the IT-BPO sector, and consumer protection regulations were introduced for e-commerce.
- The shipping turnaround time at ports has almost halved from 4.67 days in 2010-11 to 2.62 days in 2019-20. As per the latest UNCTAD data, the median ship turnaround time globally is 0.97 days, suggesting that India has room to further improve upon the efficiency at ports.
- The Indian start-up ecosystem has been progressing well amidst the Covid-19 pandemic. India is home to 38 unicorns, adding a record number of 12 start-ups to the unicorn list last year.
- India’s space sector has grown exponentially in the past six decades. India spent about US$ 1.8 billion on space programmes in 2019-20. However, the country still lags behind major players in the sector, such as USA, China and Russia. The Indian Space ecosystem is undergoing several policy reforms to engage private players and attract innovation and investment.
CHAPTER – 10
“Social Infrastructure, Employment and Human Development”
Introduction
- Public spending on social sector was increased in 2020-21 to mitigate the hardships caused by the pandemic and the loss to livelihood due to the lockdown.
- During the lockdown, online schooling took off in a big way and the Government introduced several measures to make online education accessible to all children
- Similarly the lockdown period also saw the growth of the gig economy and increasing work from home in the organized sector.
- As per the PLFS (Periodic labour force survey) report 2018-19, there was an increase in workforce totalling 48.78 crore during 2018-19 as compared to 47.14 crore during 2017- 18. The size of the workforce increased by about 1.64 crore, of which 1.22 crore were in rural sector and 0.42 crore in urban sector.
- The Government announced the fi rst relief package of Rs. 1.70 lakh crores under ‘Pradhan Mantri Garib Kalyan Yojana (PMGKY)’ in March, 2020 and comprehensive stimulus cum relief package of 20lakh crore under ‘Atma Nirbhar Bharat Abhiyan’ in May, 2020.
- Development and welfare schemes being implemented by the Government over the years together with these reliefmeasures enabled the country to endure the impact of the COVID-19 pandemic and led to a V-shaped economic recovery.
Trends in Social Sector Expenditure
- The expenditure on social services (education, health and other social sectors) by Centre and States combined as a proportion of GDP increased from 6.2 to 8.8 per cent during the period 2014-15 to 2020-21 (BE).
- This increase was witnessed across all social sectors.
- For health, from 1.2 per cent to 1.5 per cent during the period
Human Development
- India’s rank in Human Development Index (HDI) was 131 in 2019, compared to 129 in 2018, out of a total 189 countries according to UNDP Human Development Report, 2020.
- By looking at the sub-component wise performance of HDI indicators, India’s ‘GNI per capita (2017 PPP $)’ has increased from US$ 6,427 in 2018 to US$6,681 in 2019, and ‘life expectancy at birth’ has improved from 69.4 years in 2018 to 69.7 years in 2019, respectively.
- Considering the value of planetary pressures adjusted HDI (PHDI), India was positioned 8 ranks better than HDI rank. If a country puts no pressure on the planet, its PHDI and HDI would be equal, but the PHDI falls below the HDI as pressure rises.
Quality Education for All
- While India has attained a literacy level of almost 96 per cent at the elementary school level, it is still behind in achieving 100 per cent literacy.
- As per National Sample Survey (NSS),the literacy rate of persons of age 7 years and above at the All India level stood at 77.7 per cent but the differences in literacy rate attainment among social-religious groups, as well as gender still persists.
- Female literacy remained below national average among social groups of SC, ST, OBC, including religious groups of Hinduism and Islam.
- The government announced the new National Education Policy, 2020 replacing the 34 year old National Policy on Education, 1986. The new policy aims to pave the way for transformational reforms in school and higher education systems in the country
Impact of COVID-19 pandemic on School Education
- As per Annual Status of Education Report (ASER) 2020 Wave-1 (Rural), released in October 2020, percentage of enrolled children from government and private schools owning a smart phone increased enormously from 36.5 per cent in 2018 to 61.8 per cent in 2020 in rural India.
- If utilized well, the resultant reduction in the digital divide between rural and urban, gender, age and income groups is likely to reduce inequalities in educational outcomes.
- Government is implementing several initiatives to make education accessible to children during this pandemic.
Employment
- Formal Employment
- Data from Department for Promotion of Industry and InternalTrade also shows that employment reported by startups increased from 1.52 lakh in January- December, 2019 to 1.75 lakh in January-
- December, 2020 due to increase in the number of active recognition of startups from 11,694 to 14,784 in the same period.
- The net payroll data of Employees’ Provident Fund Organisation (EPFO) as on 20thDecember, 2020 shows a net increase of new subscribers in EPFO of 78.58 lakhs in 2019-20 as compared to 61.1 lakhs in 2018-19.
Unemployment
- Unemployment rates at all India level, for all ages, as per usual status, declined marginally to 5.8 per cent in 2018-19 from 6.1 per cent in 2017-18.
- The decline in unemployment rate is widespread across all the categories. The highest decline in unemployment rates is seen among those who have received formal vocational/technical training.
- The level of unemployment is recorded the highest, 20.2 per cent, among urban youth (age 15-29 years)
- The youth unemployment rates varies widely across States in India. The States like Arunachal Pradesh, Kerala, Manipur, and Bihar are on the high extreme while the States such as Gujarat, Karnataka, West Bengal and Sikkim are on the lower extreme. Unemployment rates in urban are much higher than the rural sector in most of the States/UTs.
Labour Reforms
- Years 2019 and 2020 are landmark years in the history of labour reforms, when the country saw the nearly 29 Central Labour laws being amalgamated, rationalized and simplified into four labour codes viz.
- the Code on Wages, 2019
- the Industrial Relations Code, 2020,
- The Occupational Safety, Health and Working Conditions Code, 2020 and
- the Code on Social Security, 2020,
- These laws are in tune with the changing labour market trends and at the same time accommodate the minimum wage requirement and welfare needs of the unorganized sector workers, including the self-employed and migrant workers, within the framework of legislation.
Changing Nature of Work: Gig and Platform Workers
- The nature of work has been changing with the change in technology, evolution of new economic activities, innovation in organization structures and evolving business models.
- Apart from traditional forces, new forces have created massive opportunities for the consumer and service provider to interact through innovative ways.
- Digital technology enables two-sided markets which saw the emergence of e-commerce and online retailing platforms such as Amazon, Flipkart, Ola, Uber, Urban Clap, Zomato, Swiggy etc.
- The lockdown period also saw employers preferring ‘Work from home’ of their employees, cutting down on staff strengt hand engaging freelancers or outsourcing tasks to reduce overhead costs as well as to hire skilled services.
- The benefit of the gig economy is that it allows flexibility in employer-employee relationship to both service seeker and service provider.
- The nature of job contract for a gig worker is different; their labour contract is usually shorter and more specific to the task or job assigned. The nature of payment against the work is more of piece rate, negotiable, may be as wage or partly as profit/reward than a fixed salary.
- Till recently, gig or platform workers were devoid of their basic rights and social security protections mainly because they were neither considered as worker nor employee under definition of employee in the labour laws of the country and were not entitled to legal protections under labour laws.
- For the first time, these class of workers have been brought under the ambit of the newly introduced Code on Social Security 2020 by defining them exclusively in the category of unorganized worker for providing social security benefits
Gender Dimension of Employment
- LFPR (Labour force participation rate) of females in the productive age (15-59 years) was 26.5 per cent in 2018-19, as compared to 80.3 per cent for males (rural + urban).
- While 54.7 per cent of urban women were employed in the regular wage/salaried categories, about 59.6 per cent of rural females were not only self-employed but 37.9 per cent among them were helpers in household enterprises.
- It is observed that time spent by a female on unpaid domestic services and unpaid care giving services to household members is prominent and higher than male counterparts.
Health
- India has made significant progress in improving its health outcomes over the last two decades by eliminating Polio, Guinea worm disease, Yaws and maternal & neonatal Tetanus.
- Total Fertility Rate (TFR) has reduced sharply from 3.6 in 1991 to 2.2in 2018. Maternal Mortality Ratio (MMR) was 113 per 1,00,000 live births for the period 2016-2018 and Under Five Mortality Rate (U5MR) was 36 per 1000 live births in 2018. But in 2020, it was the COVID-19 pandemic that put to test the health infrastructure of India.
- Public health measures were taken in pre-emptive, pro-active and graded manner based on the evolving scenario.
Water and Sanitation
- Swachh Bharat Mission-Grameen (SBM-G)
- Under SBM-G, rural sanitation coverage has made an incredible leap in the target achievement from 39 per cent in 2014 to 100 per cent in 2019 with more than 10 crore toilets built since 2014.
- Jal Jeevan Mission
- JJM aims to enable every rural household get assured supply of potable piped water at a service level of 55 litres per capita per day (lpcd) regularly on long-term basis.
- Goa has become first State in the country to have 100 per cent households with ‘tap water connections i.e. ‘Har Ghar Jal Rajya’.
- Keeping with ‘no one is left out’ principle, 18 districts in the country spread across Gujarat (5), Telangana (5), Himachal Pradesh (1), Jammu & Kashmir (2), Goa (2) and Punjab (3)have become ‘HarGharJal districts’.
Rural Development
- The rural sector in India witnessed the phenomenon of reverse migration during the period of complete lockdown.
- The first of measures announced under the PMGKP in March, 2020 included cash transfers of upto Rs. 1000 in two installments of Rs. 500 each to the existing old aged, widowed and disabled beneficiaries under the National Social Assistance Programme (NSAP).
- Free distribution of gas cylinders to about 8 crore families for three months was also undertaken. Limit of collateral free lending for 63lakh women SHGs increased from Rs.10 lakhs to Rs. 20 lakhs.
- An amount of Rs. 500 each was transferred for three months digitally into bank accounts of the women beneficiaries in PM Jan DhanYojana.
- Wages under Mahatma Gandhi NREGA was increased by Rs. 20 from Rs.182 to Rs. 202 w.e.f. 1st April, 2020.
Deen Dayal Antyodaya Yojana-National Rural Livelihoods Mission (DAYNRLM)
- DAY-NRLM seeks to alleviate rural poverty through building sustainable community institutions of the poor.
- Pradhan Mantri Gram SadakYojana (PMGSY)
- Its objective is to provide single all weather road connectivity to all eligible unconnected habitations of the designated population.
- The PMGSY has completed two phases and third phase has been launched with the target allocation of 1.25 lakh km all-weather road connectivity.
Garib Kalyan Rojgar Abhiyan (GKRA)
- GKRA was launched on 20th June, 2020 for a period of 125 days with a focus on 25 works in 6 States.
- The Abhiyan was a convergent effort between 12 different Central Ministries/Departments.
- The major objectives of the initiative include the provision of livelihood opportunities to returning migrants and similarly affected rural citizens, saturate villages with public infrastructure viz. roads,housing, anganwadis, panchayat bhavans, various livelihood assets and community complexes, among others and a basket of a wide variety of works.
Conclusion
- Inspite of COVID-19 pandemic, public spending on social sector has increased in 2020-21 and efforts continued through Aatma Nirbhar Bharat Rojgar Yojana, higher allocation under MGNREGA, Garib Kalyan Rozgar Abhiyan and path-breaking labour reforms etc. India’s progress towards vibrant economy is deep-seated in investing in social capital.
Economic Survey 2020-2021 (Volume 2)
👉 Join: VISHNU IAS ACADEMY FOR UPSC CSE for update
👉 Join: AnthroMaster for Anthropology updates
👉 Join: General Studies Prelims and Mains 2020&2021 for updates
👉 Join: Anthropology Discussion for Anthropology doubts