ECONOMIC SURVEY 2020-21
Economic Survey is the flagship annual document of the Ministry of finance. It gives a detailed account of the various sectors of the economy and overall economic scenario of the country in the past years and provides an outline for the year ahead. Increasingly it has also become a forum for analysis and research on the economy, and hence also a source of policy ideas. ECONOMIC SURVEY 2020-21
The Economic Survey was prepared by the Economic Division of the Department of Economic Affairs in the Finance Ministry under the overall guidance of the Chief Economic Adviser. After receiving inputs from the senior officers in the Ministry of Finance, the final version of the Economic Survey is scrutinized by the Finance Secretary and finally approved by the Union Finance Minister.
What does it contain?
1. Volume 1 – Future prospect – Intent of the government and direction of future planning.
2. Volume 2 – Report card in previous year(s) – Mainly facts and figures
Introduction- The foundational theme of the survey is “Saving Lives and Livelihoods”.
- The Economic Survey 2020-21 has been dedicated to all the COVID-19 warriors, who have really helped in upholding India.
The cover of the economic survey shows these COVID warriors including the nurses, doctors and scientists who have helped in developing the vaccine in record time and sanitation workers who have come together in the time of adversity to uphold India. The cover also shows v-shaped recovery that has happened in the India economy.
This year’s economic survey is being delivered in an e-book format. The Finance Ministry has also launched an official Economic Survey app for smooth access to the document.
- India’s response to the global epidemic was driven by research available on the Spanish Flu Epidemic (1918) and Nobel-Prize winning Hansen & Sargent (2001) policy recommendations during high uncertainty worst-case scenario prioritising loss minimization.
- It was philosophically and ethically driven by the quote mentioned above and the idea of ‘Jaan Hai to Jahaan Hai’.
- The strategy also kept in mind India’s unique vulnerabilities to the pandemic which are as follows:
- Huge Indian population meant disease would spread at higher pace.
- High population density at bottom of pyramid would increase spread rates.
- Overburdened health infrastructure would cause supply-demand mismatch increasing fatalities.
- The only strategy that seemed viable for containment of the pandemic was active surveillance, early detection, isolation, and case management, contact tracing and
- prevention of onward spread by practicing social distancing and safety precautions.
- Various non-pharmaceutical interventions (NPIs) – such as lockdowns, closure of schools and non-essential business, travel restrictions – were, therefore, adopted by countries across the globe.
- These were aimed to slow down the transmission of infection or ‘flatten the epidemic curve’ and buy the health care system some time to handle the surge in demand for its services and for development of an effective treatment and a vaccine.
Constraints unique to India
There were certain constraints which were unique to India:
First, as the pace of spread of a pandemic depends upon network effects, a huge population inherently enables a higher pace of spread.
Second, as the pandemic spreads via human contact, high population density, especially at the bottom of the pyramid, innately aids the spread of the pandemic at its onset.
Third, although the average age is low, India’s vulnerable elderly population, in absolute numbers, exceeds significantly that of other countries.
Finally, an overburdened health infrastructure exposed the country to a humongous supply-demand mismatch that could have severely exacerbated fatalities
Policy Measures Implemented- ‘Flattening of the curve’ spreads the pandemic over time, enabling more people to receive proper health treatment – ultimately lowering the fatality rate.
- Hedging during ‘black swan event’ for worst outcome initially and updating response gradually via feedback to ‘break the chain of spread’ before it reaches ‘community transmission’.
- 5T Strategy involving Test, Track, Trace, Treat, & Technology.
- Hotspots & Containment Zones were identified across India and districts classified into red, yellow, and green zones based on number of cases and other parameters.
Black Swan Event: is an unpredictable event that is beyond what is normally expected of a situation and has potentially severe consequences. They characterized by their extreme rarity, severe impact, and the widespread insistence they were obvious in hindsight.
5. India imposed the most stringent lockdown at the very onset of the pandemic. This enabled flattening of the pandemic curve and, thereby, provided the necessary time to ramp up the health and testing infrastructure. 6. India adopted a strategy of Bayesian updating to continually calibrate its response while gradually unlocking and easing economic activity. 7. Stringency Index for States in India was developed to track implementation of lockdown.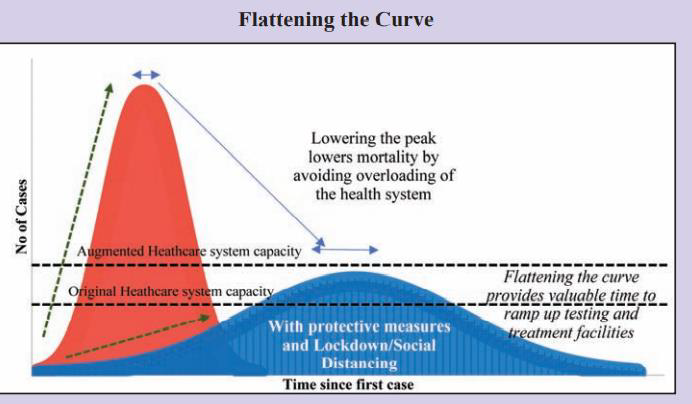 COVID pandemic affected both demand and supply:
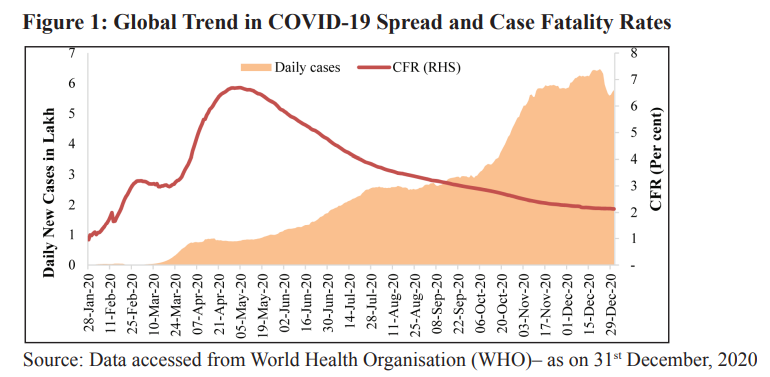
- The world economy is estimated to contract in 2020 by 4.3 per cent, as per World Bank, and 3.5 per cent, as per IMF. This recession is highly synchronized as the fraction of economies experiencing annual declines in national per capita is highest since 1870—more than 90 per cent, even higher than the proportion of about 85 per cent of countries in recession at the height of the Great Depression of 1930-32. Thus, it has rightly been called ‘Great Lockdown’.
- V-Shaped Economic Recovery Due To Timely Stringent Lockdown
- There has been 23.9 per cent contraction in GDP in Q1, the recovery has been a V-shaped one as seen in the 7.5 per cent decline in Q2 and the recovery across all key economic indicators.
- Twin Economic shocks by the pandemic
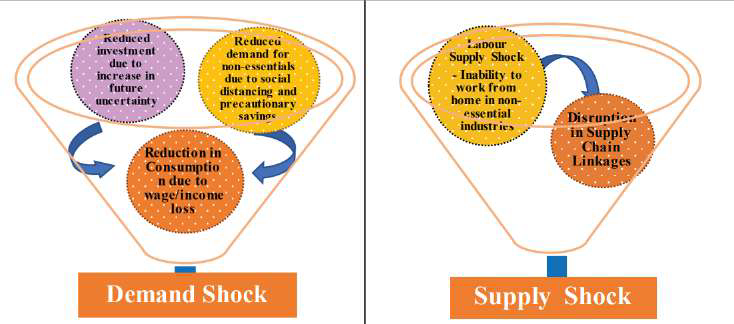 The pandemic induced lockdowns led to local, regional, and global supply disruptions hitting economic activity – rendering a ‘first order’ supply shock. This, in turn, has led to a demand shock both through disruptions in the labour market, which affect household income, and through the precautionary motive to save, which stemmed from the uncertainty amidst the health crisis.
- The V- shaped economic recovery strongly correlates with the stringency of the lockdown. This alleviates concerns that the inference about the impact of the lockdown is due to any cofounding factors peculiar to India such as higher level of immunity, BCG vaccination, etc.
- Stringency Index at the State Level Survey show that the under-or-over performance in cases and deaths (compared to the expected) correlates strongly with the stringency of the lockdown.
- Accordingly, data for lockdown efficiency in various states has been collated:
- Uttar Pradesh, Gujarat, and Bihar have restricted the case spread the best
- Kerala, Telangana, and Andhra Pradesh have saved the most lives
- Maharashtra has under-performed the most in restricting the spread of cases and in saving lives
- Thus, Survey infers that the lockdown had a causal impact on saving lives and the economic recovery.
- Carroll, et.al, 2020 showed that in the face of a prolonged and severe crises, government may want to consider a broad range of policies targeting aggregate demand, with direct transfers being only a part of the fiscal policy response.
- The fiscal policy response of the Government of India to the pandemic was, accordingly, strategized with a step-by-step approach.
- During the first two quarters of FY:2020-21, the Government ensured that funds for essential activities were available despite a sharp contraction in revenue receipts. The initial approach was to provide a cushion for the poor and section of society and to the business sector (especially the MSMEs).
- The Pradhan Mantri Garib Kalyan Yojana (PMGKY) was used for ensuring food security through public distribution system, direct benefit transfers to widows, pensioners and women, additional funds for MGNREGS, and debt moratoria and liquidity support for businesses.
- In the third quarter, government transited in a calibrated fashion to support investment and consumption demand through Atmanirbhar 2.0 and 3.0 measures.
- A slew of structural reforms were announced; together, these would help to expand supply significantly in the medium to long term.
- On the demand side, at the onset of the pandemic, India’s policies focused purely on necessities.
- During the unlock phase, demand-side measures have been announced in a calibrated manner. A public investment programme centred around the National Infrastructure Pipeline is likely to accelerate this demand push and further the recovery.
- Indian policymakers also recognized that the ‘supply’ shock induced by the lockdown would disrupt the productive capacity of the economy.
- This caused ‘under heating’ of the economy with lack of demand, disruption of supply chains and anticipated large scale corporate distress. Simple reflating of the economy through increased government expenditure would, under these circumstances, have led to runaway inflation especially given the inherent supply-side constraints in India’s food economy.
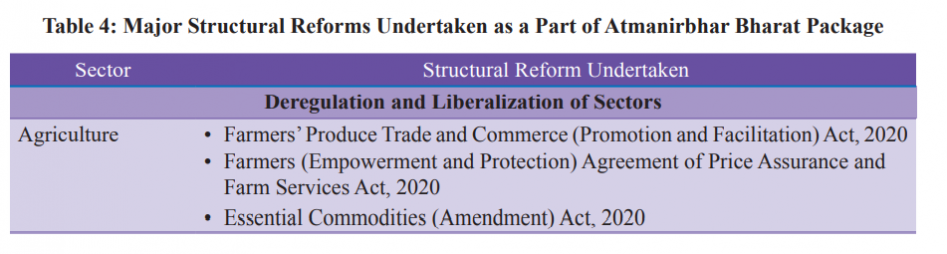
- Therefore, India initiated a slew of multi-sectoral supply-side structural reforms to lend flexibility and resilience to supply chains as a part of the Atmanirbhar Bharat Mission.
 Other Reforms Included:
- The modified definition of MSMEs facilitates expansion and growth of these enterprises without them fearing the loss of government incentives, thereby avoiding the phenomenon of dwarfs among MSMEs. The resulting economies of scale can enhance productivity without the MSMEs losing out on several government incentives including interest subvention, collateral-free loans, market support, export promotion, preferential procurement in the public sector and enabling of IT ecosystems.
- The historic labour reforms – discussed for three decades after the conditionality in the 1991 loan from IMF but never implemented thus far – will benefit MSMEs to increase employment, enhance labour productivity and thereby wages in MSMEs.
- The use of fulltime equivalents provides flexibility to MSMEs to tailor their labour strength to market conditions and thereby enhance employment. The increase in the size thresholds from 10 to 20 employees to be called a factory, 20 to 50 for contract worker laws to apply, and 100 to 300 for standing orders enable economies of scale and unleash growth.
- The drastic reductions in compliance stem from
- 41 central labour laws being reduced to four
- the number of sections falling from about 1200 to 480
- the number of minimum wages being reducing from about 2000 to 40
- one registration instead of six
- one license instead of four
- The reforms in agriculture markets will enable creation of ‘One India One Market’ for agri-products, create innumerable opportunities for farmers to move up the value chain in food processing – from farm to fork, create jobs and increase incomes.
- The proposed privatization of Public Sector Enterprises in non-strategic sectors recognizes the need for efficient allocation and use of resources. This would, in turn, lead to inclusive growth and sustained demand generation in the economy.
- The policy package ensures that the regulatory environment is conducive to ease of doing business with simpler, transparent and time bound procedures for doing business.
- Despite the hard-hitting economic shock created by the global pandemic, India is witnessing a V-shaped recovery with a stable macroeconomic situation aided by a stable currency, comfortable current account, burgeoning forex reserves, and encouraging signs in the manufacturing sector output. India is reaping the “lockdown dividend” from the brave, preventive measures adopted at the onset of the pandemic, which were based on the humane principle advocated eloquently in the Mahabharata that “Saving a life that is in jeopardy is the origin of dharma.”
CHAPTER-2
“Does Growth lead to Debt Sustainability? Yes, But Not Vice- Versa!”
INTRODUCTION:- As the COVID-19 pandemic has created a significant negative shock to demand, active fiscal policy – one that recognises that fiscal multipliers are disproportionately higher during economic crises than during economic booms – can ensure that the full benefit of seminal economic reforms is reaped by limiting potential damage to productive capacity.
- This Chapter establishes clearly that growth leads to debt sustainability in the Indian context but not necessarily vice-versa.
- This is because the interest rate on debt paid by the Indian government has been less than India’s growth rate by norm, not by exception.
- The chapter studies the evidence across several countries to show that growth causes debt to become sustainable in countries with higher growth rates.
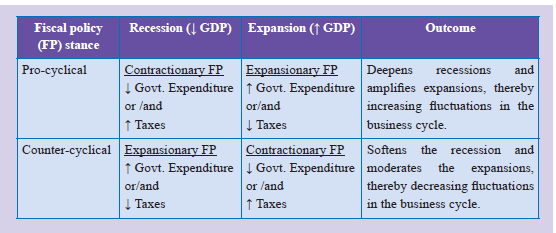
- A pro cyclical fiscal policy is the one which goes in line with the current mood of the economy.
- For example, during the time of an economic boom the government makes high expenditure and also does not increase taxes – this further amplifies the boom. While during an economic slump the government reduces expenditure, increases taxes to improve its revenue thereby putting higher pressure on the economy and amplifying the slump.
- Moreover, counter-cyclical fiscal policy becomes critical during an economic crises. This is the result of the fact that fiscal multipliers which capture the aggregate return derived by the economy from an additional Rupee of fiscal spending are significantly greater during economic crises when compared to economic boom.
- For example: In the ancient times, during difficult times like famines and droughts, the Indian Kings used to build palaces in order to provide employment to the suffering masses and improve the economic fortunes of the private sector. This clearly shows the importance of counter-cyclical economic policy.
- The Economic Survey states that, for India, in the current scenario, when private consumption, which contributes to 54 per cent of GDP is contracting, and investment, which contributes to around 29 per cent is uncertain, the relevance of counter-cyclical fiscal policies is paramount.
 DEBT SUSTAINABILITY METRICS
- Interest Rate Growth Differential : The difference between the interest rate and the growth rate in an economy.
- More negative the IRGD, the easier and quicker it is for the government to ensure debt sustainability.
- As the IRGD is expected to be negative in the foreseeable future, a fiscal policy that provides an impetus to growth will lead to lower, not higher, debt-to-GDP ratios especially given India’s growth potential even in a worst case scenario situation.
- Higher growth lowers debt-to-GDP ratios but l.ower debt does not necessarily lead to higher growth.
- A Granger causality test of this relationship for panel of advanced countries and EMEs including India, shows that while real GDP growth rate causes general government debt-to-GDP in EMEs, this relationship is not clearly seen in the advanced countries
- The crowding out effect is an economic theory arguing that rising public sector spending drives down or even eliminates private sector spending
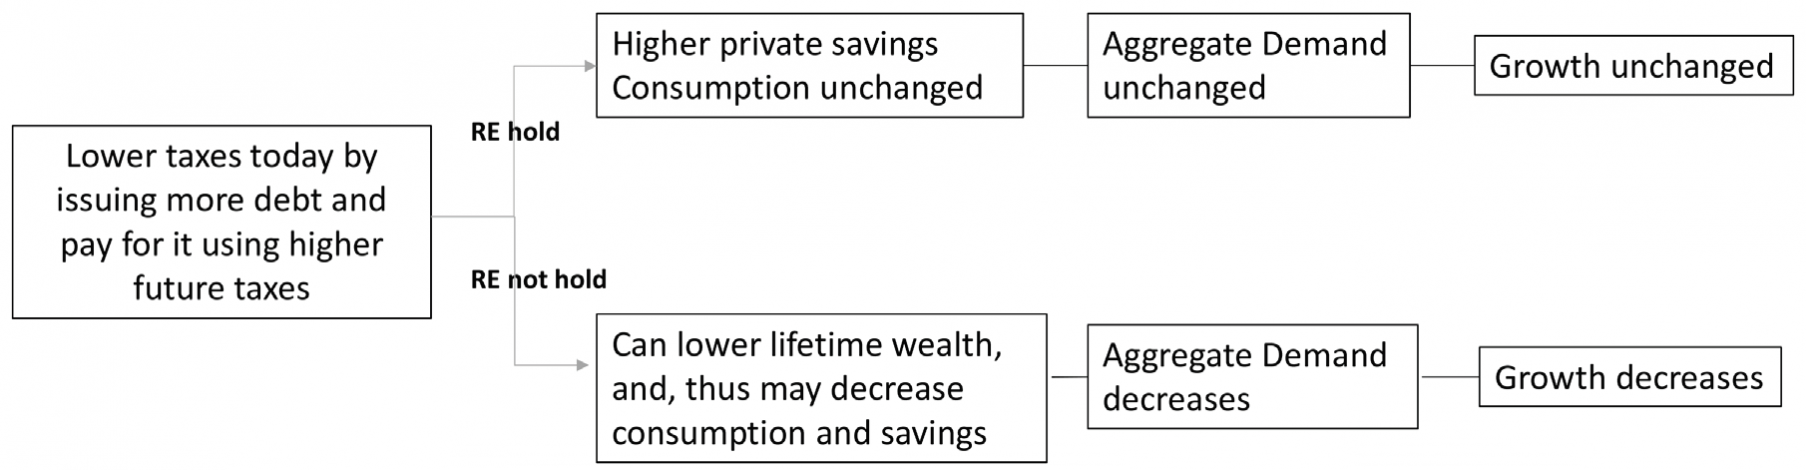 The Ricardian Equivalence Proposition (REP). REP states that forward-looking consumers, who are also assumed to be perfectly rational and perfectly capable, internalize the government’s fiscal choices when making their consumption decisions.
Structure Of India’s Debt:
A cross-country comparison of debt levels points out the following points for India: The ‘government debt level as a proportion of GDP’ is equal to the median in the group of G-20 OECD countries and in the group of BRICS nations.
The Ricardian Equivalence Proposition (REP). REP states that forward-looking consumers, who are also assumed to be perfectly rational and perfectly capable, internalize the government’s fiscal choices when making their consumption decisions.
Structure Of India’s Debt:
A cross-country comparison of debt levels points out the following points for India: The ‘government debt level as a proportion of GDP’ is equal to the median in the group of G-20 OECD countries and in the group of BRICS nations.
- India’s ‘overall debt levels as a per cent of GDP’ are the lowest amongst the group of G-20 OECD countries and also among the group of BRICS nations.
- Public debt and overall debt level for India has declined since 2003 and has been stable since 2011.
- Share of External Debt: The government’s debt portfolio which is external in nature (i.e. borrowed from outside the country) is only 2.7 per cent of GDP (5.9 per cent of total Central Government liabilities). This denotes very low foreign exchange risk.
- Distribution of Debt Between the Centre and the States: Of the total public debt, 70 per cent is held by the Centre and only 30 percent by the states. This distribution of debt between the Centre and the states is desirable since the central government is entrusted with the responsibility of macroeconomic management.
- Maturity profile of India’s Public Debt: India majorly issues longer tenure bonds for raising funding which ensures that there is no immediate pressure of returning the principal and paying the interest. This provides breathing space to projects and helps in generating revenue.
- Nature of Rate of Debt: The share of floating rate debt is very low in the overall public debt. Floating debt rate of Central government is less than 5 per cent of public debt). This tends to limit rollover risks and insulates the debt portfolio from volatility in interest rate.
- The Economic Survey concludes that India’s debt will remain sustainable due to the following factors:
- Since ‘crowding out’ of the private investment is not a phenomenon present in India, an increase in the general government debt-to-GDP correlates with lower (not higher) nominal interest rates.
- In the last three decades, a strong negative correlation between debt-to-GDP ratio and nominal interest rates in India is observed.
- The 5-year forward interest rates for all maturities (1 year, 5 years, 10 years, 20 years and 30 years) have been trending down sharply over the last decade.
- The IRGD is very likely to be negative for India in a 5-year horizon, thus leading to debt sustainability as previously discussed.
- To ensure that the economy remains in good health to avail the full benefit of these significant reforms, the “economic bridge” to the medium and long-term has to be created.
- Only an active fiscal policy – one that recognises that the risks from doing too little are much more than the risks from doing too much – can ensure that this “economic bridge” is well laid out.
- During economic crises, a well-designed expansionary fiscal policy stance can contribute to better economic outcomes in two ways.
- First, it can boost potential growth with multi-year public investment packages that raise productivity.
- Second, there is a risk of the Indian economy falling into a ‘low wage-growth trap’, as has happened in Japan during the last two decades. Implementing the NIP via front-ended fiscal spending could generate higher-paying jobs and boost productivity.
- The Economic Survey prescribes an expansionary counter-cyclical fiscal policy to usher growth and lower the debt-to-GDP ratio. It points out that it is not prudent to be too scared of debt.
- The Survey’s effort is thus to provide the intellectual anchor for the government to be more relaxed about debt during a time of economic crisis such as the one we are witnessing. Once growth picks up in a sustainable manner, it will be the time for fiscal consolidation.
CHAPTER-3
“Does India’s Sovereign Credit Rating reflect its fundamentals No!”
Introduction- Chapter reflects bias against emerging giants in sovereign credit ratings.
- Sovereign credit ratings map the probability of default and therefore reflect the willingness and ability of borrower to meet its debt obligations.
- When favourable, these can facilitate countries access to global capital markets and foreign investment.
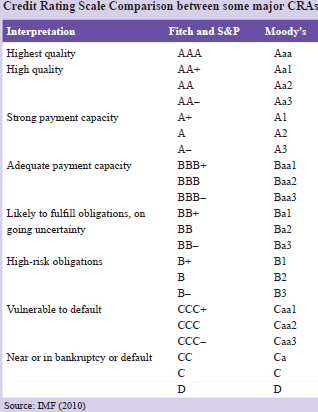
- The three key CRAs that seek to measure Sovereign credit ratings are – S&P, Moody’s and Fitch.
- Sovereign credit ratings broadly rate countries as either investment grade or speculative grade, with the latter projected to have a higher likelihood of default on borrowings.
- Credit ratings map the probability of default and therefore reflect the willingness and ability of borrower to meet its obligations.
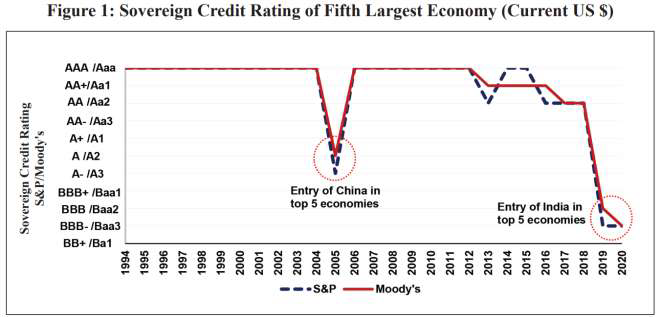
- Economic Survey 2020-21 argues that never in the history of sovereign credit ratings has the fifth largest economy in the world been rated as the lowest rung of the investment grade (BBB-/Baa3).
- Reflecting the economic size and thereby the ability to repay debt, the fifth largest economy has been predominantly rated AAA.
- India is rated BBB-/Baa3 which is the lowest possible rating for a security to be considered investment grade.
 India’s Sovereign Credit Ratings
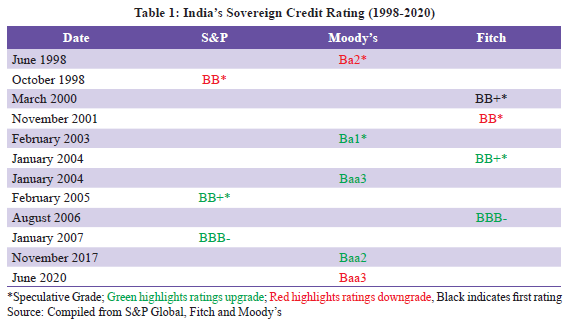
- This anomaly in sovereign credit ratings has continued for India. India’s sovereign credit rating downgrades during 1998-2018are mainly confi ned to the 1990s on account of the post-Pokhran sanctions in 1998.
- India’s sovereign credit ratings upgrades have mainly been witnessed in the second half of 2000s, in recognition of higher economic growth prospects and strengthened fundamentals of the Indian economy.
- Indian economy grew at an average rate of over six per cent and at approximately eight per cent in several years during this period. Still, India’s high rate of economic growth co-existed with a sovereign credit rating of “speculative grade”.
 Does India’s Sovereign Credit Rating ‘Actually’ Reflect its Fundamentals?
- India’s sovereign credit ratings do not reflect its fundamentals.
- Within its sovereign credit ratings cohort – countries rated between A+/A1 and BBB-/Baa3 for S&P/
- Moody’s – India is a clear negative outlier on several parameters.
- A negative correlation is observed between sovereign credit ratings and Consumer Price Index (CPI) inflation across India’s sovereign credit ratings cohort.
- In both the cases, India can clearly be seen as a negative outlier i.e. it is currently rated much below expectation for its level of GDP growth and CPI inflation.
- India’s willingness to pay is unquestionably demonstrated through its zero sovereign default history.
- Within India’s sovereign credit ratings cohort, India is rated much below expectation for its number of sovereign defaults since 1990 (which is zero for India), making it a negative outlier.
- India’s sovereign external debt as per cent of GDP stood at a mere four per cent as of September 2020.
- India’s sovereign foreign denominated debt is met through India’s forex reserves.
- India’s non-government short term-debt as per cent of forex reserves stood at 19 per cent as of September2020.
- As shown by stress test estimate, India’s forex reserves can cover an additional 2.8 standard deviation negative event.
- Sensex return on average fell, exchange rate (INR/USD) on average appreciated.
- Sensex return on average fell, exchange rate (INR/USD), on average depreciated, yield on G-Sec(5 year), on average fell, yield on G-Sec(10 year), on average fell.
- On average, Sensex return rose, on average exchange rate depriciated, on average FPI Equity fell average FPI debt too followed a similar pattern and declined.
- There is no or weak correlation between episodes of sovereign credit ratings changes and select fiscal and macro-economic indicators of India.
- It may be seen that during years of India’s sovereign credit rating changes, the average performance of macroeconomic indicators was better than or similar to the previous year.
- The Survey questioned whether India’s sovereign credit ratings reflect its fundamentals.
- It found evidence of a systemic under-assessment of India’s fundamentals as reflected in its low ratings over a period of at least two decades.
- While sovereign credit ratings do not reflect the Indian economy’s fundamentals, noisy, opaque and biased credit ratings can affect equity and debt FPI flows of developing countries, causing damage and worsening crisis.
- Sovereign credit ratings methodology must be amended to reflect economies’ ability and willingness to pay their debt obligations by becoming more transparent and less subjective.
- The pro-cyclical nature of credit ratings and its potential adverse impact on economies, especially low-rated developing economies must be expeditiously addressed.
CHAPTER-4
“Inequality and Growth: Conflict or Convergence?”
Introduction- This chapter shows that the relationship between inequality and socio-economic outcomes vis-à-vis economic growth and socio-economic outcomes is different in India from that observed in advanced economies.
- Economic Survey 2019-20 argued that ethical wealth creation – by combining the invisible hand of markets with the hand of trust – provides the way forward for India to develop economically. An often-repeated concern expressed with this economic model pertains to inequality.
- Some commentary, especially in advanced economies post the Global Financial Crisis, argues that inequality is no accident but an essential feature of capitalism. Such commentaries, thus, highlight a potential conflict between economic growth and inequality.
- The significant reduction in poverty that high economic growth has delivered in India and China presents the most striking challenge to this notion of conflict between economic growth and inequality.
- Survey examines if inequality and growth conflict or converge in the Indian context. By examining the correlation of inequality and per-capita income with a range of socio-economic indicators, including health, education, life expectancy, infant mortality, birth and death rates, fertility rates, crime, drug usage and mental health, the Survey highlights that both economic growth – as reflected in the income per capita at the state level –and inequality have similar relationships with socio-economic indicators.
- Unlike in advanced economies, in India, economic growth and inequality converge in terms of their effects on socio-economic indicators. Data reveals economic growth has a far greater impact on poverty alleviation than inequality.
- Advanced economies may choose to focus on alleviating inequality given their stage of development, their potential rate of economic growth and the absolute levels of poverty that they face. Thus, they may resolve the trade-off between growth and inequality by leaning towards alleviating inequality.
- However, despite facing the same trade-off, the policy objective of focusing on inequality may not apply in the Indian context given the differences in the stage of development, India’s higher potential rate of economic growth and the higher absolute levels of poverty.
- In India, economic growth and inequality converge in terms of their effects on socio-economic indicators.
- Across the Indian states, it is observed that both inequality and income per capita correlate similarly with socio-economic outcomes. In following data, inequality across Indian states is measured as the Gini coefficient of consumption.
- Index of health outcomes correlates positively with both inequality and income per capita across the Indian states. Opposite of advanced economies, inequality and growth converge in their effects on health among Indian states.
- Index of education, life expectancy, infant mortality, and crime respectively also show convergence of effects of inequality and growth among Indian states with respect to these indicators.
- On mental health, data shows that the effects of inequality and income per capita remain similar across the Indian states and the advanced economies.
- While birth and fertility rates decline with inequality and income per capita, death rates do not correlate with either inequality or income per capita.
- The relationship between the two types of inequality in Indian states i.e., the inequality in the ownership of asset measured by the Gini coefficients based of assets and inequality of consumption measured by the consumption-based Gini suggests a weak positive relationship between the two inequalities in India, implying that the states with greater consumption inequality are the ones facing greater asset inequality as well.
- Inequality of consumption is what matters the most rather than inequality of assets or inequality of income.
- The permanent income hypothesis posits that individuals and households attempt to smooth their consumption over time by borrowing or saving. Thus, while the income of an individual varies from year to year, consumption is more permanent as individuals tend to smooth their consumption over time.
- Measures of calculating income do not take into consideration all the available resources that result into well-being. Further, savings and borrowing practices vary across the income groups as the propensity to save is typically higher among the rich than among the poor.
- Therefore, inequality of income does not reflect the true inequality that individuals and households as consumers encounter.
- In the context of inequality, the divergence in assets among the rich and the poor do not necessarily correlate strongly with the divergence in consumption.
- Correlation between socio-economic indicators and inequality are robust irrespective of the measure of inequality used and across different time periods.
- Since inequality and income per capita do not diverge in their relationship with socio-economic outcomes in India, now it is worth asking: is perfect equality optimal?
- Perfect equalisation of outcomes ex-post, i.e., after the eff orts have been exerted to obtain those outcomes, can reduce individuals’ incentives for work, innovation and wealth creation.
- In most cases, inequality of opportunity is much more objectionable than inequality of outcomes, as individuals’ opportunities are influenced by endowments that are related to parents and other adults and a variety of chance occurrences throughout their lifetimes.
- For a developing country such as India, where the growth potential is high and the scope for poverty reduction is also significant, a policy that lifts the poor out of poverty by expanding the overall pie is preferable as redistribution is only feasible if the size of the economic pie grows rapidly
- Inequality refers to the degree of dispersion in the distribution of assets, income, or consumption. Poverty refers to the assets, income, or consumption of those at the bottom of the distribution. Poverty could be conceptualised in relative terms or in absolute terms.
- A relative measure of poverty is indeed a measure of inequality.
- However, if poverty is conceptualized in an absolute sense, that is, focusing on the absolute levels of assets, income, or consumption of those at the low end of the distribution, then increases in inequality may be accompanied by reduction in poverty.
- Feldstein (1999) disagrees with the common reaction of the popular press and academic discussions that regards inequality and not poverty as the problem. He postulates that policy should aim at addressing poverty rather than inequality.
- Absolute poverty should be of greater concern than inequality.
- Of course, it is possible that if the incomes of the rich pull too far away from the rest of society, growing frustration may lead to rising crime, withdrawal from civic engagement, and loss of social cohesion but in India’s case these concerns are minimal.
CHAPTER-5
“Healthcare takes centre stage, finally!”.
Introduction- COVID-19 pandemic emphasized the importance of healthcare sector and its inter-linkages with other sectors – showcased how a health crisis transformed into an economic and social crisis.
- The ongoing pandemic has showcased how a healthcare crisis can get transformed into an economic and social crisis.
- Given its potential to provide healthcare access in remote areas, telemedicine needs to be harnessed to the fullest by especially investing in internet connectivity and health infrastructure.
- As a bulk of the healthcare in India is provided by the private sector, it is critical for policymakers to design policies that mitigate information asymmetry in healthcare, which creates market failures and thereby renders unregulated private healthcare sub-optimal.
- Key learnings need be gleaned from the current health crisis. To enable India to effectively respond to future pandemics, the health infrastructure must be agile.
- Given its potential to provide healthcare access in remote areas, telemedicine needs to be harnessed to the fullest by especially investing in internet connectivity and health infrastructure.
- The National Health Mission (NHM) has played a critical role in mitigating inequity as the access of the poorest to pre-natal and post-natal care as well as institutional deliveries has increased significantly. Therefore, in conjunction with Ayushman Bharat, the emphasis on NHM should continue.
- An increase in public spending from 1 to 2.5-3 % of GDP – as envisaged in the National Health Policy 2017 – can decrease the Out-Of-Pocket Expenditures from 65 to 30 % of overall healthcare spending.
- Bulk of the healthcare in India is provided by the private sector, it is critical for policymakers to design policies that mitigate information asymmetry in healthcare, which creates market failures and thereby renders unregulated private healthcare sub-optimal. Therefore, information utilities that help mitigate the information asymmetry can be very useful in enhancing overall welfare.
- A sectoral regulator to undertake regulation and supervision of the healthcare sector must be considered given the market failures stemming from information asymmetry; WHO also highlights the growing importance of the same.
- The mitigation of information asymmetry would also help lower insurance premiums, enable the offering of better products, and help increase the insurance penetration in the country.
- Similarly, maternal mortality correlates negatively with increases in per-capita public health expenditure. Increased health expenditure also reduces Out-of-Pocket expenses preventing vulnerable groups from slipping into poverty.
- In case of low levels of public health expenditure, i.e. were public healthcare expenditure as a % of GDP is less than 3 %, Out Of Pocket expenditure as a share of total health expenditure drops precipitously when public health expenditure increases. For instance, an increase in public health expenditure from the current levels in India to 3 % of GDP can reduce the OOP expenditure from 60 % currently to about 30 %.
- Healthcare systems do not self-organise using the force of free markets because of three key inherent and unchanging characteristics (Arrow, 1963):
- Uncertainty/variability of demand (Falling victim to disease cannot be predicted but need for medical and especially emergency care is inelastic in nature. Thus, insurance is a logical safety net.)
- Information asymmetry (Patients are unable to judge quality of healthcare received while insurance agencies do not have access to patient data such as dietary habits, lifestyle choices etc. leading to higher premiums.)
- Hyperbolic tendencies (Indulgence in risky behaviour and underestimating health risks)
- Hence, any active system design of healthcare must be mindful of these inherent characteristics.
- Salience Bias refers to the fact that individuals are more likely to focus on items that are more prominent and ignore those that are less so.
- Given these market failures, a free market where individual consumers purchase services from providers on their own while paying at the point of service leads to severely sub-optimal outcomes including demand that can be influenced and induced by suppliers, over-seeking of hospitalization and under-seeking of primary care/public health when compared to economically optimal levels, and catastrophic out-of-pocket spending in part due to the low preference for health insurance.
- Therefore, most well-functioning health systems are structured as oligopolies purchasing from oligopsonys instead of individual consumers purchasing from individual providers. Thus, a key role for the government is to actively shape the structure of the healthcare market.
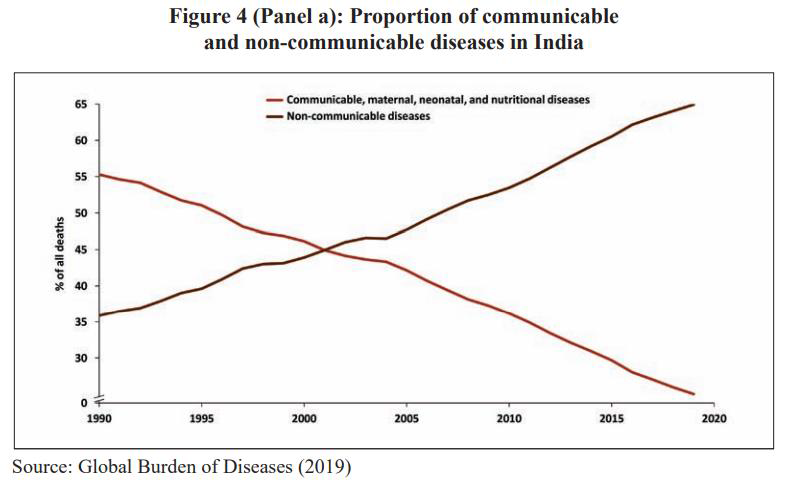
- As pandemics represent rare events, healthcare policy can become a victim of “saliency bias”, which involves over-weighting recent phenomena. 71 % of global deaths and about 65 % of deaths in India are caused by non-communicable diseases (NCDs). Between 1990 and 2016, the contribution of NCDs increased 37 % to 61 % of all deaths (National Health Portal).
- Further, preventing communicable diseases requires focus on better sanitation and drinking water, which the Swachh Bharat and the Har Ghar Jal Abhiyan campaigns are already focusing on.
- Also, better health infrastructure is no guarantee that a country would be able to deal better with devastating pandemics like Covid-19 as seen in the experience of European and North American nations. As the next health crisis could possibly be drastically different from COVID- 19, the focus must be on building the healthcare system generally rather than a specific focus on communicable diseases.
- Despite improvements in healthcare access and quality (healthcare access and quality scored at 41.2 in 2016, up from 24.7 in 1990), India continues to underperform in comparison to other Low and Lower Middle Income (LMIC) countries. On quality and access of healthcare, India was ranked 145th out of 180 countries (Global Burden of Disease Study 2016).
- With respect to MMR (Maternal Mortality Rate) and IMR (Infant Mortality Rate), India still needs to improve significantly on these metrics.
- Hospitalisation Rates in India are among the lowest in the world at 3-4 % reflecting lower access and utilisation of healthcare.
- India has one of the highest levels of OOPE (Out-Of-Pocket Expenditure) in the world.
- However, the distribution of the public subsidy has improved in favour of the poor, more clearly in maternity and child healthcare. Earlier studies have argued that public sector-based healthcare has been pro-rich (or aggressive). This had resulted in poor households being disproportionately impacted by OOPE and pushed below the poverty line.
- In recent times, the percentage of the poorest utilising prenatal care through public facilities has increased from 19.9 per cent to 24.7 per cent from 2004 to 2018, and there is a similar increase in the percentage of the poor accessing institutional delivery as well as post-natal care.
- The poorest utilising inpatient care and outpatient care has increased from 12.7 per cent to 18.5 per cent and from 15.6 per cent to 18.3 per cent.
- At the same time, both inpatient and outpatient utilisation among the richest dropped from 29.2 per cent to 26.4 per cent and 30.1 per cent to 26.9 per cent, respectively.
 Low Budget Allocations
- Health is a state subject in India, spending on healthcare by states matters the most when examining government healthcare spending.
- According to National Health Accounts, 2017, 66 % of spending on healthcare is done by the states. India ranks 179th out of 189 countries in prioritization accorded to health in its government budgets.
- Also, the richer states are spending a lower proportion of their GSDP on healthcare. The states that have higher per capita spending have lower out-of-pocket expenditure, which also holds true at global level. Hence, there is need for higher public spending on healthcare to reduce OOP.
- World Health Organization (WHO) identified an aggregate density of health workers to be 44.5 per 10,000 population and an adequate skill-mix of health workers to achieve composite SDG tracer indicators index by 2030 (WHO 2019). The WHO also specified a lower range of 23 health workers per 10,000 population to achieve 80 per cent of births attended by skilled health professionals
- Aggregate human resources for health density in India is close to the lower threshold of 23, the distribution of health workforce across states is lop-sided. Also, the skill mix (doctor/nurse-midwives ratio) is far from adequate.
- State-level variations in the density of health workers and the skill mix reflects that while Kerala and Jammu and Kashmir have a high density of doctors, states like Punjab, Himachal Pradesh and Chhattisgarh have a larger number of nurses and midwives but a very low density of doctors. Andhra Pradesh, Delhi, and Tamil Nadu reflect a better balance of doctors and nurses and midwives.
- While the share of public institutions has increased both in hospital and outpatient cares, the private sector dominates in total healthcare provision in India. Around 74 % of outpatient care and 65 % of hospitalisation care is provided through the private sector in urban India.
- In fact, Kane and Calnan (2017) highlight the erosion of trust in the Indian healthcare sector. To understand the difference in quality between the public and private sector providers, survey uses data from PMJAY.
- Among the most common metrics of quality in the hospital setting is unplanned readmissions . Readmissions typically impose a heavy burden on patients and their families and on health systems in general because of unnecessary care. In general, readmissions are costlier than original admissions. Public sector patients get readmitted to the same hospital 64 % of the time versus 70 % for private hospitals.
- Quality of treatment in the private sector does not seem to be markedly better when compared to the public sector. Yet, the costs of treatment are not only uniformly higher in the private sector, but the differences are also humongous for in-patient treatments of severe illnesses.
- Data clearly highlights the presence of asymmetric information in the Indian private health insurance market. Unregulated private healthcare system is clearly sub-optimal compared to a system where policies mitigate the problem of asymmetric information.
- Finally, given the information asymmetries that make unregulated private enterprise suboptimal in healthcare, a sectoral regulator that undertakes regulation and supervision of the healthcare sector must be seriously considered.
- This is especially pertinent as regulation has grown in importance as a key lever for governments to affect the quantity, quality, safety, and distribution of services in health systems
- Issuance of the Telemedicine Practice Guidelines 2020 by the Ministry of Health and Family Welfare (MoHFW) on March 25, 2020 saw e Sanjeevani OPD (a patient-to-doctor tele-consultation system) record almost a million consultations since its launch in April 2020.
- Similar growth was also reported by Practo, which mentioned a 500 % increase in online consultations in just three months.
- Thus, the success of telemedicine critically hinges on having decent level of health infrastructure and Internet connectivity nationwide. Specifically, investing in Internet access, can lead to greater uptake of telemedicine, which in turn can greatly help reduce geographic disparities in healthcare access and utilization.
- The recent COVID-19 pandemic has emphasised the importance of healthcare, whereby a healthcare crisis transformed into an economic and social crisis. Considering the same and in striving to achieve the SDG target of Universal Healthcare Coverage, India must take steps to improve healthcare accessibility and affordability in the country.
- India’s healthcare policy must continue focusing on its long-term healthcare priorities. Simultaneously, to enable India to respond to pandemics, the health infrastructure must be agile. For instance, every hospital may be equipped so that at least one ward in the hospital can be quickly modified to respond to a national health emergency while caring for the normal diseases in usual times. Research in building such health infrastructure can guide how to build such flexible wards.
- Technology-enabled platforms offer a promising new avenue to address India’s last-mile healthcare access and delivery challenges. These technology platforms coupled with digitisation and the promise of artificial intelligence at-scale, have led to a drastic uptake in the utilisation of telemedicine for primary care and mental health. Given India’s unique last mile challenges, such technology-enabled solutions need to be harnessed to the fullest.
- Both Central and the State governments need to invest in telemedicine on a mission mode to complement the government’s digital health mission and thereby enable greater access to the masses.
CHAPTER-6
“Process Reforms: Enabling decision-making under uncertainty”
Introduction- In this chapter, issue of over-regulation is illustrated through time taken for a company to undergo voluntary liquidation in India (1570 days even when there is no litigation/dispute).
- Using the framework of incomplete contracts, the chapter argues that the problem of over-regulation and opacity in Indian administrative processes flows from the emphasis on having complete regulations that account for every possible outcome. This is due to the inadequate appreciation of the difference between ‘Regulation’ and ‘Supervision’, on the one hand, and the inevitability of incomplete regulations, on the other hand.
- The problem is that policymakers, by default, tend to favour prescriptive regulation over supervision. The optimal solution is to have simple regulations combined with transparent decision-making process. Having provided the government decision maker with discretion, it is important then to balance it with three things- improved transparency, stronger systems of ex-ante accountability (such as bank boards) and ex-post resolution mechanisms.
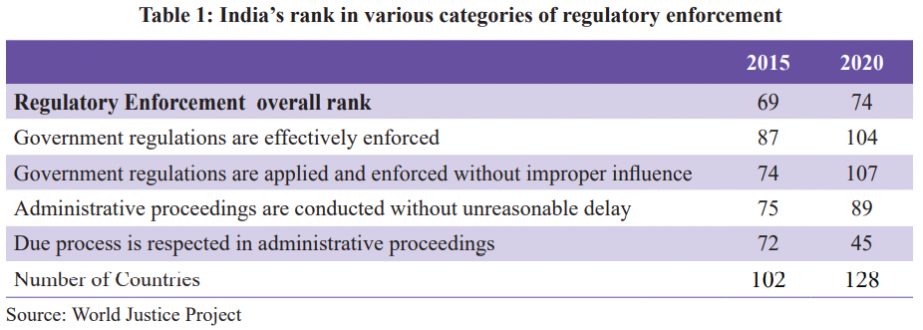
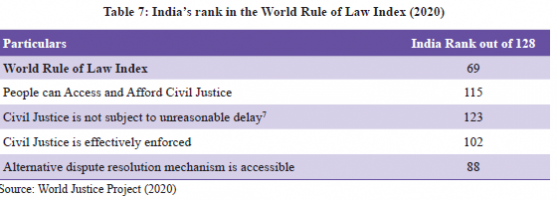
- The real issue of Indian administration seems to be effectiveness of regulations caused by undue delays, rent seeking, complex regulations, and quality of regulation.
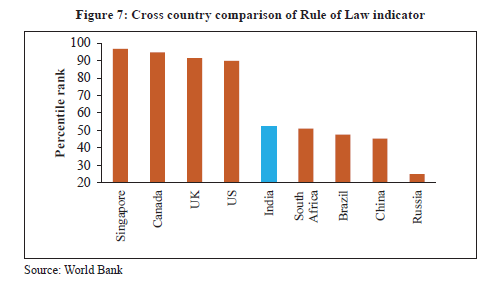
- The ‘World Rule of Law Index’ published by the World Justice Project provides cross country comparison on various aspects of regulatory enforcement as seen in table below.
- World Bank’s Ease of Doing Business (EoDB) report (2020) shows that despite making huge strides in the overall EoDB rank, India still lags in the sub-categories ‘Starting a business’ and ‘Registering Property’ where the country’s rank is 136 and 154 respectively. The report points out that this is due to the high number of procedures required to legally start and formally operate a company as well as the time and cost consumed to complete each procedure.
- A study by Quality Council of India (done for Economic Survey) shows that the time taken from point of decision of closure to actually the company getting struck off from the Registrar of Companies is 1570 days (4.3 years), even if all paperwork is in place and the company is not involved in any litigation or dispute. This is the best possible case of a routine activity.
- Interestingly, out of the total time taken, about 1035 days are taken for clearances by Income Tax, Provident Fund, GST departments and in taking back security refunds from various departments . In contrast, voluntary liquidation takes about 12 months in Singapore, 12- 24 months in Germany and 15 months in UK.
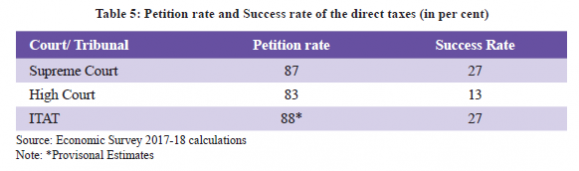
- Thus, bureaucracies prefer to make decisions based on regulatory checklists to prevent ex-post scrutiny and questioning of use of discretionary powers. Hence, Government departments take actions either to tick off boxes in checklist of regulation or follow the default precedent. Thus, we see routine appeals made by the government departments against unfavourable judgements in higher courts or tribunals to reduce any questioning later (e.g tax terrorism).
 Solving for Discretion
- In order to fulfill ‘Maximum Governance, Minimum Government’ we wish to promote supervision instead of regulation and thus provide more discretion to officers.
- So, ex-ante regulation cannot substitute for ex-post supervision; in fact, more ex-ante regulation only serves to dilute the quality of ex-post supervision by fostering opaque discretion. There is an immediate need to strengthen ex-ante accountability entrusted with the boards of institutions.
- Bringing transparency in the decision-making process apart from having intrinsic value, is appreciated because it promotes trust in public institutions and makes market efficient.
- There is a need for building resilient ex-post resolution mechanism for efficient legal systems (i.e., courts and institutions) such as Insolvency and Bankruptcy Code (IBC), Debt Recovery Tribunals etc.
- However, the court system remains the single most important way for ex-post resolution.
 Direction of Administrative Process Reforms
- Labour falls under the Concurrent List of the Constitution, therefore both Parliament and State legislatures can make laws regulating labour. This led to multiplicity of regulations.
- Government of India merged the existing 29 central labour laws into 4 labour codes.
- The Code on wages was passed in July 2019.
- Industrial Relations Code, 2020
- Code on Occupational Safety, Health & Working Conditions Bill, 2020
- Social Security Code, 2020 were passed in the parliament.
- The regulatory framework for Other Service Providers (OSP) was till recently, outdated, and complex. For instance, the Business Process Outsourcing (BPO) industry increasingly runs on global cloud-based systems, but Indian regulations restricted its use and insisted on a local EPABX. Further, there were restrictions on Work from Home and onerous registration requirements.
- Hence, to reduce the compliance burden of the BPO industry, government announced new guidelines on OSPs on 5th November 2020. Under the new regulations, the registration requirement for OSPs has been done away with altogether and the BPO industry engaged in data-related work has been taken out of the ambit of OSP regulations.
- Similarly, several other requirements, which prevented companies from adopting ‘Work from Home’ and ‘Work from Anywhere’ policies have also been removed. This has significantly liberalized the regulation for the BPO sector.
- The need for process simplicity extends to the institutional architecture as well. The ultimate source of supervision is public scrutiny and public leadership. Since it is not possible for the public to scrutinize everything, the focus should be on a strong but limited state, rather than weak and an all-pervasive state. This is in line with government’s idea of ‘Minimum Government and Maximum Governance’.
- Finally, there is a case for enacting Transparency of Rules Act to end any asymmetry of information regarding rules and regulations faced by a citizen. Under this act, all departments will need to mandatorily place all citizen-facing rules on their website. Officials will not be able to impose any rule not explicitly mentioned on the website clearly. Further, all laws, rules and regulations will have to be presented as an updated, unified whole always. This will bring transparency and simplify the understanding of regulations.
- Discretion, however, needs to be balanced with transparency, systems of ex-ante accountability and expost resolution mechanisms. The experience with GeM portal for public procurement illustrates how transparency not only reduces purchase prices but also provides the honest decision maker with a clean process.
- However, the above intellectual framework has already informed reforms ranging from labour codes to removal of onerous regulations on the BPO sector. The same approach is also reflected in the rationalization of autonomous bodies.
CHAPTER-7
“Regulatory Forbearance: 07An Emergency Medicine, Not Staple Diet!”
Introduction:- This chapter studies the policy of regulatory forbearance adopted following the 2008 Global Financial Crisis (GFC) to extract Emergency measures such as forbearance prevent spillover of the failures in the financial sector to the real sector, thereby avoiding a deepening of the crisis. important lessons for addressing economic challenges posed by COVID-19 pandemic.
- In this chapter, survey talks about the adverse impacts of continuing Regulatory forbearance long after the economic recovery, viz.
- Bank restructuring loans even for unviable entities, inflated profits thus increased dividend to shareholders leading to severe undercapitalization also incentivizing risky lending practices including lending to zombies.
- Misallocation of credit not only damages the quality of investment in the economy but also leads to deterioration in corporate governance.
- Regulatory Forbearance: A regulatory policy (i.e., a policy implemented by central banks and other regulatory authorities) that permits banks and financial institutions to continue operating even when their capital is fully depleted.
- The current regulatory forbearance on bank loans has been necessitated by the COVID-19 pandemic. his chapter studies the policy of regulatory forbearance adopted following the 2008 Global Financial Crisis (GFC) to extract important lessons for the current times. Regulatory forbearance for banks involved relaxing the norms for restructuring assets, where restructured assets were no longer required to be classified as Non-Performing Assets (NPAs henceforth) and therefore did not require the levels of provisioning that NPAs attract.
- The inflated profits were then used by banks to pay increased dividends to shareholders, including the government in the case of public sector banks. As a result, banks became severely undercapitalized. Undercapitalization distorted banks’ incentives and fostered risky lending practices, including lending to zombies. As a result of the distorted incentives, banks misallocated credit, thereby damaging the quality of investment in the economy.
- Concerned that the actual situation might be worse than reflected on the banks’ books, RBI initiated an Asset Quality Review to clean up bank balance sheets. While gross NPAs increased from 4.3% in 2014-15 to 7.5% in 2015-16 and peaked at 11.2% in 2017-18, the AQR could not bring out all the hidden bad assets in the bank books and led to an under-estimation of the capital requirements. This led to a second round of lending distortions, thereby exacerbating an already grave situation.
- The first lesson for policymakers is to treat emergency measures as such and not to extend them even after recovery: when an emergency medicine becomes a staple diet, it can be Second, while the learnings from the previous episode must be employed to avoid a recurrence, ex-post analysis of complex phenomena must be disciplined.
- Specifically, to enable policymaking that involves an exercise of judgement amidst uncertainty, ex-post inquests must recognise the role of hindsight bias and not make the mistake of equating unfavourable outcomes to either bad judgement, or worse, malafide intent.
- Emergency measures such as forbearance prevent spill over of the failures in the financial sector to the real sector, thereby avoiding a deepening of the crisis. Therefore, as emergency medicine, forbearance occupies a legitimate place in a policy maker’s toolkit.
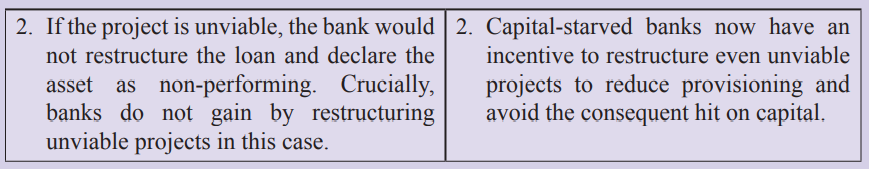
- Banks have following choices:
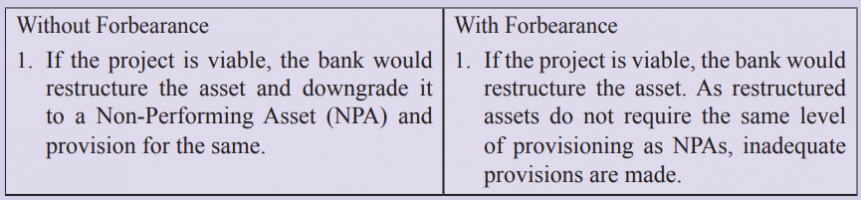
 Therefore, banks prefer restructuring, as this choice allows them to declare fewer NPAs and avoid the costs due to loan provisioning. Forbearance thus incentivizes banks to take risks by restructuring stressed assets even if they are unviable.
- Capital-constrained banks, therefore, choose to restructure even unviable projects when the opportunity arises under a forbearance regime, thereby shifting risk away from equity holders to depositors and taxpayers. This is because in the unlikely case of firm revival, bank would receive principal and interest amount back instead of writing it off as a loss and recapitalizing.
- Sarkar, Subramanian, and Tantri, 2019 show that bank CEOs’ post-retirement career benefits, such as future corporate board memberships, are associated with distortionary practices during their tenure. Forbearance provides incumbent managers an opportunity to window-dress their balance sheets, show good performance during their tenure, and thereby enhance post-retirement career benefits.
- Banks’ management may use forbearance as a shield to cover up outright corruption and nepotism.
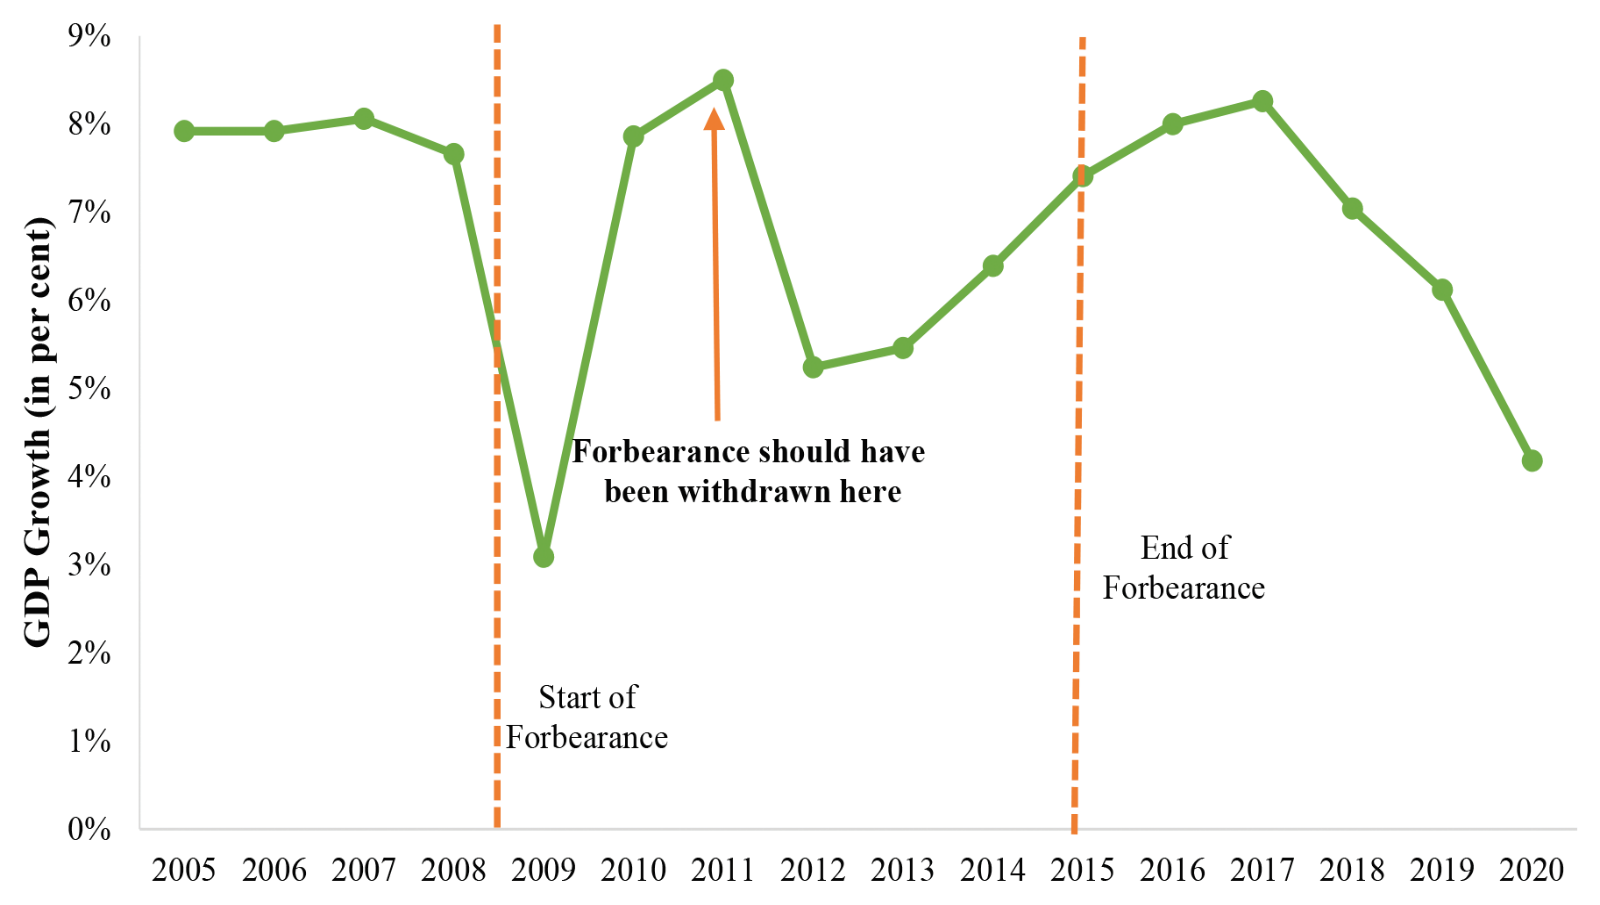
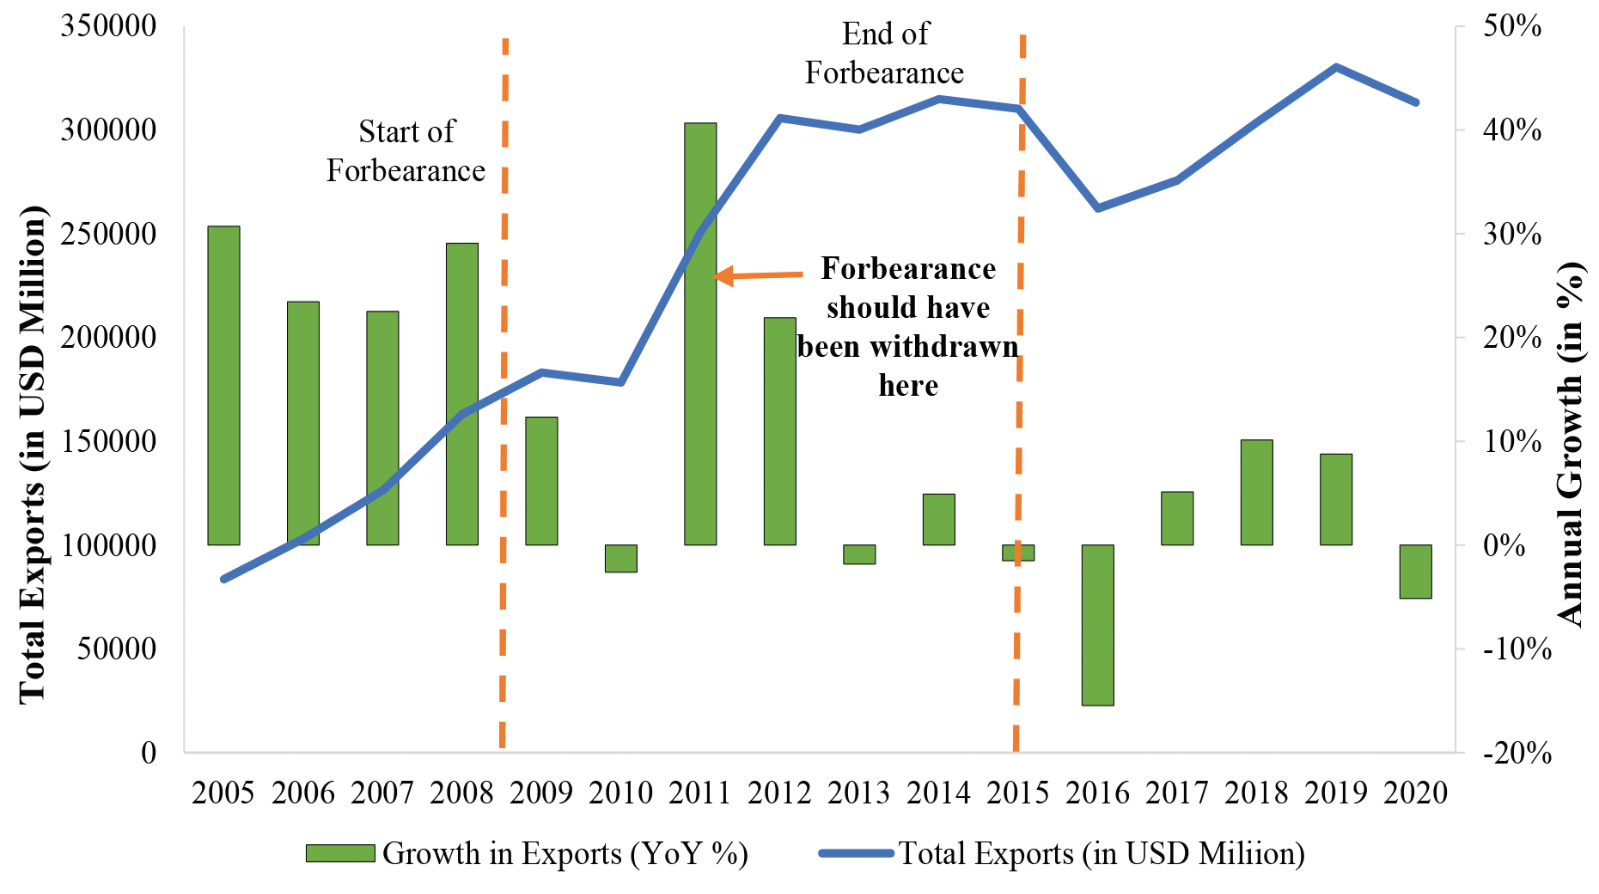
- The forbearance policies had desired short-term economic effects. GDP growth recovered from a low of 3.1% in FY2009 to 8.5% within two years. Marked improvement was observed in other economic indicators ranging from exports to the Index of Industrial Production (IIP), growth in total revenue of listed firms also recovered from a low of 4.88% during the crisis to a high of over 20% in 2011.
- However, the propensity to restructure any given borrower, including unviable ones was significantly higher in the years after the crisis. Evidently, once the banks got a signal about the continuation of forbearance despite the economic recovery, several types of distortions crept in. The share of restructured loans increased from 0.74% in FY2008 to 6.94% in FY2015.
- During the forbearance window, the proportion of firms in default increased by 51% after their loan(s) got restructured. In the pre-forbearance era, there was only a marginal 6% increase in the likelihood of defaults after restructuring. Forbearance thus helped banks to hide a lot of bad loans.
- The P. J. Nayak Committee (2014), constituted by RBI, highlighted in its report submitted in May 2014 the twin concerns stemming from the forbearance regime: ever-greening of loans by classifying NPAs as restructured assets and the resultant undercapitalization of banks. Thus, in essence, many banks were undercapitalized during the forbearance period.
- Once the forbearance policy was discontinued in 2015, RBI conducted an Asset Quality Review to know the exact amount of bad loans present in the banking system. As a result, banks’ disclosed NPAs increased significantly from 2014-15 to 2015-16.
 Growth in Exports
 Cost Of Extended Forbearance Versus Early Resolution Of Banking Crises: International Evidence
- The countries that reached their peak NPA during 2009 and 2010 (2009-2010) are called “Early Resolvers” & “Late Resolvers” correspond to the countries that reached their peak NPAs in 2015-19, i.e. up to a decade post the crisis. As shown in the case of India, where a prolonged policy of regulatory forbearance allowed banks to delay recognition of actual NPAs, a delay in taking actions to recognize and resolve bad loans may have caused the NPAs to culminate many years after the crisis.
- NPAs for the late resolvers were more than thrice that for the early resolvers and impact on GDP growth for the late resolvers (-1.7% on average) was significantly worse than that for the early resolvers (-0.8% on average)
- Forbearance lets undercapitalized banks operate without raising capital. Since equity capital is privately expensive to the owners of banks, the banks may use the forbearance window to withdraw their capital. Thus, the usual pecking order of finance [(Myers (1977), Modigliani & Miller (1958)], where debt is repaid before equity, gets reversed.
- Eventually, when forbearance gets withdrawn, either depositors or the taxpayers are called upon to foot the bill. Banks with a high share of restructured loans raised less fresh capital than banks with a low share of restructured loans.
- More dividend payments and less capital infusion exacerbated the undercapitalization of banks with higher restructuring. The combined effect of higher dividends and lower fresh capital led to a stark difference in the Capital Adequacy Ratio (CAR) between the two types of banks.
- Banks become increasingly risk-seeking, undercapitalized banks find risky lending and shady lending practices, such as those based on high upfront fees, attractive. Forbearance period witnessed an increase in lending to unproductive firms, popularly referred to as “zombies”.
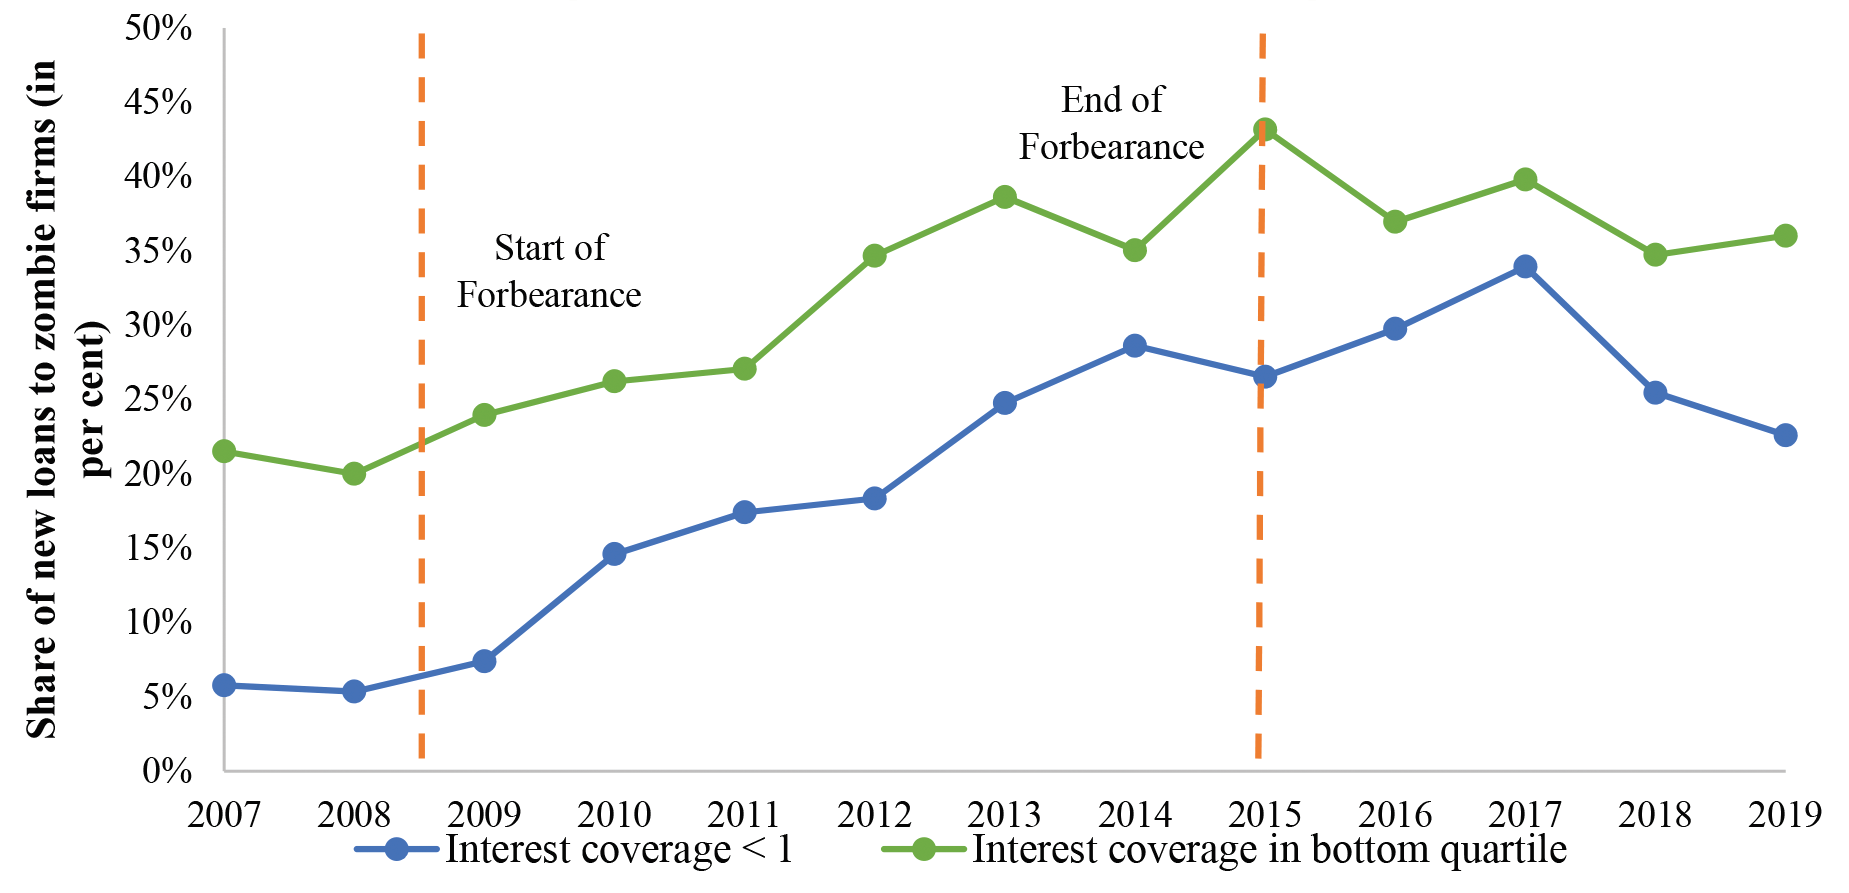
- Zombies are typically identified using the interest coverage ratio, the ratio of a firm’s profit after tax to its total interest expense. Firms with an interest coverage ratio lower than one are unable to meet their interest obligations from their income and are categorized as zombies.
- To assess whether it is indeed the case of risky lending, a revised definition of zombie firms is considered. Under this alternative definition, zombie firms are those whose interest coverage ratio lies in the bottom quartile. This definition ensures that the proportion of zombies remains the same across all years.
- Even with the revised definition, the share of new loans sanctioned to zombie firms is found to increase from 20% in 2007-08 to 43% in 2014-15.
 Ever-greening of Loans
- There is another motive for undercapitalized banks to engage in lending to poor quality firms: to protect their already depleted capital. One way of ever-greening loans is lending a new loan to a borrower on the verge of default, near the repayment date of an existing loan, to facilitate its repayment (Tantri, 2020). Such transactions go undetected as banks are not required to disclose them, unlike restructurings that warrant disclosures.
- To further disguise their lending to distressed borrowers, banks may direct credit to other healthy firms in the business group to which those borrowers belong.
- A business group is classified as a zombie if the interest coverage ratio of the entire group is less than one.
- Thus, forbearance resulted in increased lending to firms with poor fundamentals and higher lending to inefficient projects. Consequently, the industrial sector’s increased credit growth
- from 2008-09 to 2014-15 failed to translate into a higher investment rate. India’s Gross Fixed Capital Formation as a share of GDP reduced from 34.7% in 2008 to 28.7% in 2015.
- This suggests that the increased credit supply was not used productively by firms. Chopra, Nishesh, and Tantri (2020) show that this credit was instead diverted for the private benefit of the incumbent management. They argue that the incumbent managers’ ability to get loans restructured under the forbearance policy strengthened their influence within the firm.
- It became difficult for the firm’s board to overthrow such managers even if they were otherwise inefficient. The increased influence of the incumbent management resulted in the weakening of the firms’ governance which, in turn, had detrimental consequences in the longer run.
- Given that promoters are the controlling shareholders in most Indian firms, the non-promoter directors are specifically required to uphold the interests of minority shareholders. They are supposed to act as watchdogs against the likelihood of firms’ management indulging in unhealthy practices such as expropriation of resources or investments in value-destroying projects that may personally benefit the promoters. Therefore, a decline in the proportion of non-promoter directors implies a weakening of governance among firms.
- the presence of independent directors on boards declined,
- the propensity of a CEO becoming the chairman increased,
- having a connected director on board became more likely,
- the bank monitoring declined as a lower number of bank-nominated directors occupied board seats.
- Beneficiary firms under the forbearance regime also seem to have misallocated capital in unviable projects. there was a much higher rise in the number, proportion, and rupee value of stalled projects for restructured firms in the forbearance window. Total stalled projects (as a proportion of all capex projects) increased by 40% (30%) during forbearance, while the same witnessed a decline of 12% (18%) pre-forbearance.
- Increase in private benefits being redirected to the firms’ management. In the Indian context, related party transactions (RPTs) are often utilized to camouflage the expropriation of firm resources.
- Related party transactions to key personnel increased by around 34% among firms whose loans were restructured during the forbearance regime
- Hence, the increased, lax restructuring seems to have resulted in the misappropriation of firm resources at the cost of minority shareholders.
- Because of the weakened governance, the impacted firms’ performance deteriorated. There was a significant increase in leverage (15.7%), measured as the ratio of debt to equity, accompanied by a 27.2% decline in the interest coverage for firms restructured during the forbearance regime.
- There also seems to be a detrimental impact on firms’ liquidity, as evidenced by a 30% decrease in their quick ratio compared to a marginal 4% decrease in the pre-period.3 Finally, the firms’ profitability, measured as profits as a proportion of firms’ assets, suffered a sharp decline of over 138% in the forbearance era.
- Overall, while firm fundamentals usually improved upon restructuring in the preforbearance era, they significantly declined under forbearance.
- After the deterioration in their fundamentals, restructured firms in the forbearance window also witnessed a decrease in their credit ratings. Average credit rating for a firm deteriorated by 7.7% upon restructuring during the forbearance regime while the same marginally improved (0.33%) before forbearance
- The proportion of restructured firms that became defaulters increased by 51% in the forbearance period, while the pre-period increase was comparatively marginal (by 6%).
- In conclusion, the prolonged forbearance policy meant to address grievances of crisis hit borrowers led to unintended negative consequences for the firms in the long run. The internal governance of the firms weakened, misappropriation of resources increased, and their fundamentals deteriorated.
- After continuing forbearance for seven years, the RBI decided to bite the bullet and withdrew regulatory forbearance starting from April 2015. The RBI also decided to conduct a detailed Asset Quality Review (AQR) to know the true status of banks’ NPAs.
- Economic theory highlights that two contrasting outcomes were possible with such an AQR. In the optimistic view, the AQR was expected to lead to a reduction in information asymmetry. resultant cleaner bank balance sheets would help banks to raise more private capital on their own, thereby improving the quality of financial intermediation. Along these lines, the RBI’s view was that the program was a “deep surgery” that would lead to healthy bank balance sheets
- Myers and Majluf (1984) predict that firms in distress would have no incentive to raise equity voluntarily as managers – who know more about the firm’s fundamentals than investors – fear dilution of the value of equity. Therefore, absent a policy for either mandatory capital raising or capital backstop, incumbent shareholders, and managers of banks – who would invariably know more about the bank’s fundamentals than the regulator or investors – have no incentive to raise equity capital.
- As a result, under-capitalized banks may again resort to risk-shifting and zombie lending, thereby severely exacerbating the problem.
- The adverse impact could then spill over to the real economy through good borrowers and projects being denied credit. The resultant drop in the investment rate of the economy could then lead to the slowdown of economic growth. Chopra, Subramanian, and Tantri (2020) provide careful evidence that this is precisely what transpired following the AQR.
- India’s AQR differed from the typical bank clean-ups carried out in other major economies such as Japan, the European Union, and the U.S. in two key aspects. First, the clean-up was undertaken when the country was not undergoing an economic crisis.
- Second, there was neither a forced recapitalization of the banks nor was an explicit capital backstop provided for.
- In reality, the AQR exercise significantly under-estimated the full extent of NPAs as well as the resultant capital infusion that was required to ensure that the bank balance sheets indeed become healthy.
- To be sure, the AQR did lead to some clean-up of the toxicity in the bank balance sheets. Kashyap, Mahapatro, and Tantri (2020) argue that the AQR was mostly restricted to targeting bad lending through restructuring, rather than identifying subtle ever-greening activities.
- The recent events at Yes Bank and Lakshmi Vilas Bank corroborate that the AQR did not capture ever-greening carried out in ways other than formal restructuring. RBI audit missed some severe cases of ever-greening by these banks
- The actual capital required by public sector banks significantly exceeded the amount that the RBI seems to have estimated before the AQR. In the first year of the AQR, the total capital infused into public sector banks was INR 25,000 crores with an intended plan of infusing INR
- 45,000 crore in the next three years under Mission Indradhanush. However, by the end of FY2019, i.e. four years after the inception of the AQR, the government had infused INR 2.5 lakh crores in the public sector banks.
- As the banks were unable to raise adequate fresh capital after the clean-up, their lending reduced. Thus, in an already stressed banking sector, the second wave of under-capitalization caused by the AQR created perverse incentives to lend even more to the unproductive zombie borrowers.
- Banks’ tightening of credit supply negatively impacts healthy borrowers as it forces firms to cut down on their investments and capital expenditures. Thus, the likelihood of stalling of ongoing projects increases.
- Chopra, Subramanian, and Tantri (2020) find that the firms more exposed to the AQR- affected banks could not entirely replace their credit supply from other financial institutions. Thus, these firms became financially constrained and reduced their capital expenditures, leading to ongoing projects being stalled.
- Remember that forbearance represents emergency medicine that should be discontinued at the first opportunity when the economy exhibits recovery, not a staple diet that gets continued for years. Therefore, policymakers should lay out thresholds of economic recovery at which such measures will be withdrawn. These thresholds should be communicated to the banks in advance so that they can prepare for the same. As well, forbearance should be accompanied by restrictions on zombie lending to ensure a healthy borrowing culture.
- A clean-up of bank balance sheets is necessary when the forbearance is discontinued. Given the problem of asymmetric information between the regulator and the banks, which gets accentuated during the forbearance regime, an AQR exercise must be conducted immediately after the forbearance is withdrawn.
- The asset quality review must account for all the creative ways in which banks can evergreen their loans. The banking regulator needs to be more equipped in the early detection of fault lines and must expand the toolkit of ex-ante remedial measures.
- A clean-up unaccompanied by mandatory capital infusion exacerbates bad lending practices.
- Apart from re-capitalizing banks, it is important to enhance the quality of their governance. Ever-greening of loans by banks as well as zombie lending is symptomatic of poor governance, suggesting that bank boards are “asleep at the wheel” and auditors are not performing their required role as the first line of defence. Sound governance is a key metric to ensure that banks do not engage in distortionary lending post capital infusion. The regulator may consider penalties on bank auditors if ever-greening is discovered as part of the toolkit of ex-ante measures. This would thereby create incentives for the auditor to conduct the financial oversight more diligently.
- While the learnings from the previous episode must be employed to avoid a recurrence, ex-post analysis of complex phenomena must be disciplined by the insights highlighted in Chapter 7 of the Survey.
- Finally, the legal infrastructure for the recovery of loans needs to be strengthened de facto. The Insolvency and Bankruptcy Code (IBC) has provided the de jure powers to creditors to impose penalties on defaulters. However, the judicial infrastructure for the implementation of IBC – comprised of Debt recovery tribunals, National Company Law Tribunals, and the appellate tribunals must be strengthened substantially
CHAPTER-8
“Innovation: Trending Up but needs thrust, especially from the Private Sector”
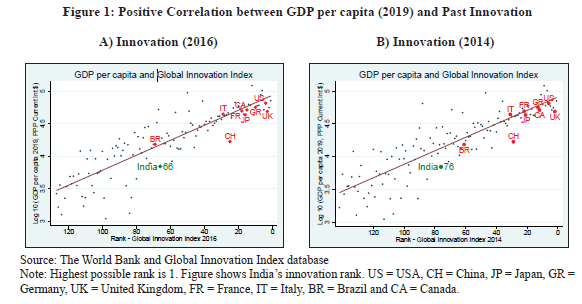
Introduction:- India entered the top 50 innovating countries for the first time in 2020 since the inception of the Global Innovation Index (GII) in 2007, by improving its rank from 81 in 2015 to 48 in 2020. Also, as the 5th largest economy, India’s aspiration must be to compete on innovation with the top ten economies.
- The business sector in India contributes much less to gross expenditure on R&D (about 37%) when compared to businesses in each of the top ten economies (68% on average). This is despite the fact the tax incentives for R&D were more liberal in India when compared to those in the top ten economies. The Government does a disproportionate amount of heavy lifting on R&D by contributing 56% of the gross expenditure on R&D, which is three times the average contributed by governments in the top ten economies. thrust on R&D by the business sector.
- Indian government sector contributes the highest share of total R&D personnel (36%) and researchers (23%) amongst the top ten economies (9% on average). Indian firms also perform below expectation on innovation for their level of access to equity finance, which is the most crucial for innovation.
- India must significantly ramp up investment in R&D if it is to achieve its aspiration to emerge as the third largest economy in terms of GDP current US$. Mere reliance on “Jugaad innovation” risks missing the crucial opportunity to innovate our way into the future. This requires a major thrust on R&D by the business sector.
- 27th in knowledge and technology outputs (KTO)
- 31st in market sophistication
- 55th in business sophistication
- 60th in human capital and research (HCR)
- 61st in institutions
- 64th in creative output and
- 75th in infrastructure.
- Among parameters:
- India ranks first in ICT services exports
- third in domestic market scale (PPP)
- ninth in government’s online services
- ninth in growth rate of productivity
- 12th in science and engineering graduates
- 13th in ease of protecting minority investors
- 15th in e-participation
- 16th in average expenditure of top three global R&D companies and
- 19th in market capitalisation
- The importance of technological progress in economic growth began with the Solow model (Solow 1956), which highlighted that output per worker mainly depends on savings, population growth and technological progress.
- While the Solow model treats technological progress as exogenous, the new growth theory endogenises technological progress and suggests several determinants of the same. These include:
- human capital
- search for new ideas by profit-oriented researchers
- infrastructure
- improving quality of existing products
- Endogenous growth has also been explained using the Shumpeterian model of creative destruction, where innovative products brought to the market by entrants lead to replacement/ destruction of the old ones produced by the incumbents.
- The relation between innovation and research sector received attention with endogenous growth models.
- Some postulated that R&D activities could make long run growth possible and R&D effects on aggregate production functions were tested. Research showed that small enterprise R&D activities brought large returns to the national economy through new technologies.
- For India to become an innovation leader, it needs greater thrust on innovation. India’s aspiration must be to compete on innovation with the top ten economies.
- India’s gross domestic expenditure on R&D (GERD) is lowest amongst other largest economies.
- The government sector contributes a disproportionate large share in total GERD at three times the average of other largest economies.
- However, the business sector’s contribution to GERD is amongst the lowest.
- The business sector’s contribution to total R&D personnel and researchers also lags behind that in other large economies.
- This situation has prevailed despite the tax incentives for innovation having been more liberal than other economies.
- India’s innovation ranking is much lower than expected for its level of access to equity capital.
- This point towards the need for India’s business sector to significantly ramp up investments in R&D.
- Indian residents’ share in total patents filed in the country stands at 36 per cent. This lags behind the average of 62 per cent in other largest economies. Resident share in patent applications must rise for
- India to become an innovative nation.
- India must focus on improving its performance on institutions and business sophistication innovation inputs. These are expected to result in higher improvement in innovation output.
- Although India has performed above expectation on innovation with respect to its level of development, India lags behind most other large economies (top ten in terms of GDP current US$) on most indicators of innovation. Although India performs in line with its level of development, India ranks second lowest, after
- The GII is co-published by Cornell University, INSEAD, and the World Intellectual Property Organization
- (WIPO), a specialized agency of the United Nations.
- It seeks to assist economies in evaluating their innovation performance.
- GII has two sub-indices:
- the Innovation Input Sub-Index
- the Innovation Output Sub-Index
- It has seven pillars, each consisting of three sub-pillars, further divided into a total of 80 indicators.
- The Innovation Input sub-index and the Innovation Output Sub-Index have equal weight in
- calculating the overall GII. Brazil, on the overall GII.
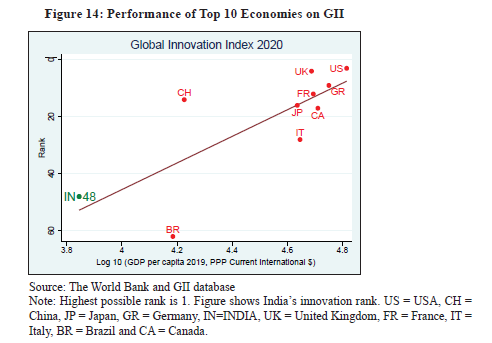 The Innovation Input sub-index has five pillars:
- Institutions
- Human Capital and Research
- Infrastructure
- Market Sophistication and
- Business Sophistication
- The Innovation Output Sub-Index has two pillars:
- Knowledge and Technological outputs and
- Creative outputs
- GII was first conceptualised in 2007
- India has consistently improved on GII from rank 81 in 2015 to rank 48 in 2020 and while India has performed impressively, there is scope for much more improvement. To put things into perspective, China has improved its rank from 29 to 14 during the same period. China embarked on an ambitious R&D roadmap to become an innovation-oriented economy.
- Research & Development (R&D) investment is a key input in innovation. Although India’s GERD (Gross Domestic Expenditure on R&D as % of GDP in relation to the level of development measured by GDP per capita on PPP basis) is in line with expectation for its level of development, there is much scope for improvement. Other top ten economies such as USA, China, Japan, Germany, and France have higher than expected GERD for their level of development.
- India’s business sector and higher education sector contribution to GERD as % of GDP is in line with its level of development. However, the business sector’s GERD in USA, China, Japan, and Germany is much higher as expected for their level of development. Higher education sector in Canada and Germany also has larger GERD than their level of development.
- In India, the Government contributes 56% of GERD while this proportion is less than 20% in each of the top ten economies. Yet, India’s GERD is much lower than that of the top ten economies because India’s business sector contributes a much smaller % to total GERD
- The total number of patents filed in India has risen steeply since 1999, mainly on account of increase in patent applications filed by non-residents. While patent applications filed by residents have increased steadily since 1999, they have risen at a much lower rate than patent applications by non-residents.
- Large-scale out-migration of skilled workforce and students from India is not necessarily bad news for India’s innovation aspirations. This could potentially result in return of higher-skilled workforce in future. However, this would require an enabling environment that facilitates re-entry into the Indian job-market and high-tech research opportunities.
- Unlike India, Brazil and Canada, other top ten economies (GDP current US$) have a higher share of patent applications by residents than non-residents.
- Total number of trademark applications filed in India has risen steeply since 1999 mainly on account of increase in trademark applications filed by residents. India’s trend of larger resident-share in total trademark applications is similar to that observed across other top ten economies (GDP current US$) except Canada.
- India and Brazil rank much below expectation for their level of equity market development in the overall GII, innovation outputs and innovation inputs amongst the top ten largest economies.
- Given that most of these large economies are more innovative than India and equity market development facilitates greater high-technology innovation, this potentially indicates that innovation in India needs to become more high-tech intensive.
- India and Brazil rank much below expectation for their level of debt market development in the overall GII, innovation outputs and innovation inputs amongst the top ten largest economies.
- India needs greater thrust on innovation to catapult itself to a higher growth trajectory and become the third largest economy in GDP current US$ in the near future.
- This requires boosting gross expenditure on R&D from 0.7 per cent of GDP currently, to at least the average level of GERD in other top ten economies (GDP current US$) of over two per cent.
- It also involves significantly scaling up R&D personnel and researchers in the country, especially in the private sector.
- India’s business sector needs to rise to the occasion and significantly ramp up its gross expenditure on R&D to a level commensurate to India’s status as the fifth largest economy in GDP current US$.
- Indian business sector’s contribution to total R&D personnel and researchers also needs to be scaled up from 30 per cent and 34 per cent per cent respectively to the average level in other top ten economies (58 per cent and 53 per cent respectively).
- Given the low level of contribution to GERD by the business sector despite the generous incentive regime prevailing earlier, businesses in India must focus on innovation to remain competitive in the new economy.
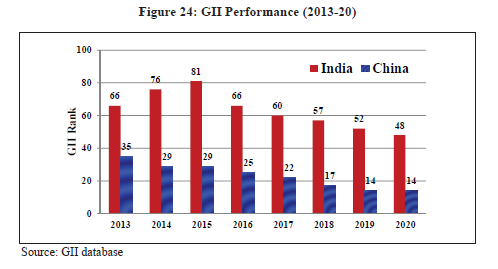 Conclusion
- As Economic Survey 2019-20 discussed in the chapter “Entrepreneurship and Wealth Creation at the Grassroots”, the Start-up India campaign of the Government of India recognises entrepreneurship as an increasingly important strategy to fuel productivity growth and wealth creation in India. This assumes greater importance in the context of enhancing private participation in innovation in India – in terms of contribution to gross expenditure on R&D, R&D personnel and researchers, and share in patents filed in the country. The lessons drawn therein on the crucial role of literacy, education, physical infrastructure and policies enabling ease of doing business, as drivers of new firm creation and entrepreneurship, remain relevant in this analysis.
CHAPTER-9
“JAY Ho: Ayushman Bharat’s Jan Arogya Yojana (JAY) and Health Outcomes”
Introduction PM-JAY was implemented in 2018, health indicators measured by National Family Health Surveys 4 (in 2015-16) and 5 (in 2019-20) provide before-after data to assess impact of its implementation. PM-JAY is being used significantly for high frequency, low-cost care such as dialysis and continued to be utilised without disruption even during the COVID-19 pandemic and the lockdown. General medicine – the overwhelmingly major clinical specialty accounting for over half the claims – exhibited a V-shaped recovery after falling during the lockdown and reached pre-COVID-19 levels in December 2020. Overall, the comparison reflects significant improvements in several health outcomes in states that implemented PM-JAY versus those that did not. These effects stemmed directly from enhanced care enabled by insurance coverage; others represent spill over effects due to the same. PM-JAY: Status & Progress So Far- As per the latest annual report of PM-JAY released by the National Health Authority (NHA, 2019), the status of implementation is as follows:
- 32 states and UTs implement the scheme
- 13.48 crore E-cards have been issued
- Treatments worth INR 7,490 crore have been provided (1.55 crores hospital admission)
- 24,215 hospitals empanelled
- 1.5 crore users have registered on the scheme’s website (mera.pmjay.gov.in)
- Samuelson (1954) conceptualised certain goods as “public goods” and argued that that “no decentralized pricing system can serve to optimally determine these levels of collective consumption (of the public good).” As public goods are non-rival and non-excludable, market failures predominate in the provision of such goods. The decentralised free market system that works through prices cannot force consumers to reveal their demand for purely non-excludable goods, and so cannot lead to producers meeting that demand.
- The presence of strong linkages between public goods provision and economic development accentuates the need for the provision of public good at national, regional, and international levels (UNIDO 2008). Governance therefore entails effective delivery of public goods and services to the vulnerable sections of society.
- As free markets under-provision public goods, a vital role of a government is to provide public goods to its citizens, especially to the vulnerable sections in a society. While the rich can seek private alternatives, lobby for better services, or if need be, move to areas where public goods are better provided for, the poor rarely have such choices (Besley and Ghatak, 2004).
- Thus, provision of public goods can particularly affect the quality of living of the vulnerable sections in a society. Yet, governments may suffer from the “horizon problem” in a democracy, where the time horizon over which the benefits of public goods reach the electorate may be longer than the electoral cycles (Keefer 2007 and Keefer and Vlaicu 2007).
- Thus, provision of public goods that generate long-term gains to the economy and the society represents a key aspect of governance in a democratic polity.
- As healthcare represents a critical public good, successive governments have committed to achieve universal health coverage (UHC). In 2018, Government of India approved the Ayushman Bharat Pradhan Mantri Jan Arogya Yojana (AB-PM-JAY) as a historic step to provide healthcare access to the most vulnerable sections in the country. Beneficiaries included approximately 50 crore individuals across 10.74 crores poor and vulnerable families, which form the bottom 40% of the Indian population.
- The households were included based on the deprivation and occupational criteria from the Socio-Economic Caste Census 2011 (SECC 2011) for rural and urban areas, respectively. The scheme provides for healthcare of up to INR 5 lakh per family per year on a family floater basis, which means that it can be used by one or all members of the family. The scheme provides for secondary and tertiary hospitalization through a network of public and empanelled private healthcare providers. It also provides for 3 days of pre-hospitalization and 15 days of post hospitalization expenses, places no cap on age and gender, or size of a family and is portable across the country. It covers 1573 procedures including 23 specialties. AB-PM-JAY also aims to set up 150,000 health and wellness centres to provide comprehensive primary health care service to the entire population.
- Countries are increasingly adopting the policy of universal healthcare to reduce inequalities in healthcare provision which is strongly related to inequality of income (Amado 2020). The likelihood of financial insecurity, medical debt or bankruptcy is reduced if the families have access to these insurance programs.
- Therefore, medical insurance coverage allowed for greater financial stability alongside improving child’s educational attainment and future earnings. The insurance coverage of the parents tends to be positively correlated with children’s benefit as child’s health is directly influenced by the health of his parents, with healthy parents leading to positive childhood developments.
- V-shaped behavior of health service recovery
- The V-shaped behaviour is likely to be due to both demand and supply side effects.
- Supply side constraints
- Health care workers might have cut back on services out of initial fear of infection or it is possible that pre-authorization processes were skipped.
- Many private hospitals were not providing services for fear of infection and government hospitals were reserved for COVID-19 patients.
- Demand side constraints
- On the demand side, patients avoided hospitals due to fear of contracting the virus.
- The access to medical services could have been impeded by lack of transport or finances during the lockdown.
- Both the demand and supply side factors seem to have since recovered completely during the unlock phase.
- The Survey first compares West Bengal (PM-JAY not implemented) with neighbouring Assam, Sikkim, and Bihar (PM-JAY implemented) on various health indicators followed by all states that did not implement PM-JAY vis-à-vis all states that did. The findings from this difference-in-difference analysis are summarised as follows:
- The proportion of households that had health insurance increased in Bihar, Assam, and Sikkim from 2015-16 to 2019-20 by 89% while it decreased by 12% over the same period in West Bengal. When comparing across all the states over this time, proportion of households with health insurance increased by 54% for the states that implemented PM-JAY, fell by 10% in states that did not. Thus, PM-JAY enhanced health insurance coverage
- From 2015-16 to 2019-20, infant mortality rates declined by 20% for West Bengal and by 28% for the three neighbouring states. Similarly, while Bengal saw a fall of 20% in its Under-5 mortality rate, the neighbours witnessed a 27% reduction.
- Modern methods of contraception, female sterilization and pill usage went up by 36%, 22% and 28% respectively in the three neighbouring states while the respective changes for West Bengal were negligible. While West Bengal did not witness any significant decline in unmet need for spacing between consecutive kids, the neighbouring three states recorded a 37% fall.
- Various metrics for mother and childcare improved more in the three neighbouring states than in West Bengal.
- Each of the effects described above (points 2-4) manifested similarly when we compare all states that implemented PM-JAY versus the states that did not.
- Health insurance Cover: Health insurance or fi nancing scheme increased by 54 per cent from NFHS 4 to NFHS 5 in the states that adopted PM-JAY, it decreased by 10 per cent in the states that did not adopt PM-JAY.
- Level of schooling: The average proportion of both women and men with 10 or more years of schooling improved similarly across the two groups of states.
- Infant and Child Mortality rate: Neonatal mortality rate (NNMR) declined by 22 per cent in the states that adopted PM-JAY in comparison to a 16 per cent decline in states that did not adopt PM-JAY.
- Family Planning: The proportion of people currently using any method of family planning rose by 15 per cent in the PM-JAY adopted states and only by 7 per cent (less than half) in the other states.
- Maternal and Child health : While the proportion of mothers who had at least four antenatal care visits remained constant between the NFHS surveys in the states which adopted PM-JAY, the proportion declined by 3 per cent among the non-PM-JAY states.
- Institutional births: Institutional births in public facility and home births are much higher in the states which did not adopt the PM-JAY.
- Vaccination of the child and vitamin-A supplementation: It improved remarkably in the states which adopted the PM-JAY as compared to the states which did not adopt the PM-JAY.
- Childhood diseases: The proportion of children with diarrhea in the two weeks preceding the survey who received oral rehydration salts (ORS) increased by 9 per cent between the surveys in the PM-JAY states as compared to a 5 per cent increase in the non-PM-JAY states.
- Awareness about HIV/AIDS: PM-JAY has not only been successful in improving health outcomes across states, but has also accounted for the increase in the spread of knowledge and awareness regarding important health concerns like HIV/AIDS.
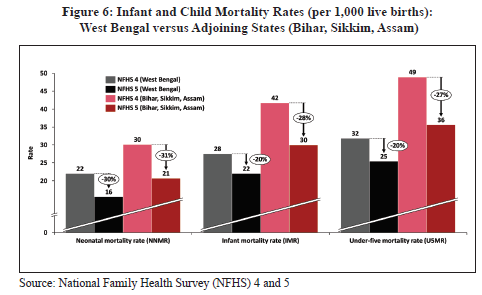 Concluding Observations
- The difference-in-difference computations that control for confounding factors, shows that states adopting PM-JAY are able to improve their health outcomes.
- Relative to states that did not implement PM-JAY, states that adopted it experienced greater penetration of health insurance, experienced a reduction in infant and child mortality rates, realized improved access and utilization of family planning services, and greater awareness about HIV/AIDS.
- While some of these effects stemmed directly from enhanced care enabled by insurance coverage, others represent spillover effects due to the same. Even though only a short time has elapsed since its introduction, the effects that are identified by the Survey underscore the potential of the program to significantly alter the health landscape in the country, especially for the vulnerable sections.
CHAPTER-10
“The Bare Necessities”
Introduction The Finance Ministry in its Economic Survey for 2020-21 has introduced a new metric to gauge progress on the quality of bare necessities available such as drinking water, sanitation, shelter, electricity and LPG called the Bare Necessities Index (BNI). Since the 1950s, the idea of “minimum needs”, can be viewed as a process of providing the “bare necessities of life” to citizens has been around in India. A family’s ability to access bare necessities – such as housing, water, sanitation, electricity and clean cooking fuel – have therefore been regarded as an important barometer of economic development in academic and policymaking circles. The BNI has been developed as a means of assessing economic development using the “basic needs” approach.- The BNI measures access to “the bare necessities” for households in rural areas, urban areas and at the all India level.
- Source Data: The data is sourced from two National Statistical Office (NSO) Rounds on drinking water, sanitation, hygiene, and housing condition in India: 69th (2012) and 76th (2018).
- Created for: All States/UTs by employing the data at State level.
- Water
- Sanitation
- Housing
- Micro-Environment
- Other facilities (Kitchen type: Ventilation of the dwelling unit, Access of the household to bathroom, public/community use with payment, electricity etc.)
- Overall
- Highest access: Highest in Kerala, Punjab, Haryana, Gujarat, Uttrakhand, Delhi, Goa, Mizoram and Sikkim, while lowest in Odisha, Jharkhand, West Bengal and Tripura.
- Improving states: Haryana, Punjab, Uttarakhand, Gujarat, Kerala, Rajasthan, Uttar Pradesh, Bihar, Madhya Pradesh, Chhattisgarh, and North East states except for Tripura, Nagaland and Meghalaya.
- Highest access: Highest in Punjab, Kerala, Sikkim, Goa and Delhi, while the lowest in Uttar Pradesh, Madhya Pradesh, Bihar, Jharkhand, West Bengal, Odisha, Assam, Manipur and Tripura.
- Improvement: J&K, Punjab, Rajasthan, Gujarat, Maharashtra, Karnataka, Chhattisgarh, Tamil Nadu,
- Andhra Pradesh, Kerala, Goa, Meghalaya and Arunachal Pradesh.
- In urban India, no State is showing the lowest level of BNI in 2018, and the States showing improvement
- over 2012 include Uttarakhand, J&K, Punjab, Rajasthan, Madhya Pradesh, Maharashtra, Karnataka,
- Kerala, Tamil Nadu, Arunachal Pradesh and Manipur
- Improvement: The access to drinking water to households in most of the States has improved in 2018 compared to 2012, in rural as well as in urban areas, (except for Andhra Pradesh in Rural and Andhra Pradesh and Himachal Pradesh in urban areas).
- Top and bottom: States such as Sikkim, Punjab, Haryana and Gujarat are at the top while Odisha, Jharkhand and Andhra Pradesh are at the bottom on the drinking water accessibility index.
- Regional disparities: Regional disparities have increased in 2018 when compared to 2012 despite such disparities declining in urban areas.
- Equity in access: Across all groups, equity in access to drinking water increased in 2018 when compared to 2012.
- Improvement: The sanitation access has improved for all States in rural areas and for most of the States in urban areas in 2018 compared to 2012.
- to sanitation have declined as the states having
- low access to sanitation in 2012 have gained
- However, inter-State diff erences in access to
- sanitation are still large, especially in rural areas.
- Improvement: The access to housing has improved in all States, except urban areas in few States.
- Inter-State disparities: The inter-State disparities have also declined as the States having low level in 2012 have gained more. However, the gaps in the levels across states have been large, especially in rural areas.
- The index measures the percentage of households who are living in a dwelling unit with access to drainage (indicated in terms of access to drainage and quality of drainage in terms of other than Katcha drainage), without problems of flies/mosquitoes (indicated by other than severe), and efforts made by local bodies/State government to tackle problem of flies/mosquitoes.
- Improvement: Micro-environment has improved in 2018 for all States, except for Assam in rural and Odisha and Assam in urban areas, as compared to 2012.
- Regional disparities: Regional disparities have declined sharply in urban areas in 2018 vis-à-vis 2012, though it was increased in the rural areas. The micro-environment is much better in urban areas when compared to the rural areas, and the rural-urban gaps are large.
- Equity in access: The access to microenvironment in 2018 has improved especially to the lowest income quintile in rural as well as in urban areas.
- The index captures the availability of kitchen, kitchen with a water tap, good ventilation in house, access to bathroom, attached bathroom, electricity use, the types of wiring used instead of temporary electric wiring, and type of fuel used for cooking (LPG or others).
- Improvement: Access to Other-facilities for a household has improved for all States in 2018 compared to 2012 for rural as well as in urban areas except for Himachal Pradesh in urban.
- Inter-states disparities: The inter-states disparities in terms of these facilities have also declined, especially in the urban areas.
- Equity in access: The equity in access to other facilities has improved in rural and urban areas. The gaps are still high across the State in rural, between rural and urban in States, between income groups, and between rural and urban in income groups.
- Health Outcomes
- Research highlights the health benefits that can accrue from greater access to the bare necessities:
- Swachh Bharat Mission led to a decrease in diarrhea and malaria cases in children below five years,
- Access to improved sanitation also reduces the risk of contracting diarrhoea.
- Access to the piped water and sanitation is critical in reducing the child mortality substantially.
- The distance and time spent on fetching water from the source is found to affect under-five child health and increase the risk of illness.
- Access to clean cooking fuel improves child health.
- Having a separate kitchen improves the indoor environment, thereby yielding health benefits to the household, especially women and children.
- Access to housing, better housing conditions and amenities are closely connected with health outcomes.
- Research studies support that the access to bare necessities through its possible linkages can positively impact educational indicators as well.
- Water hauling, a daily activity, consumes substantial time and effort of a household. It is found that water hauling activity is negatively associated with the girls’ school attendance.
- Access to latrine in schools substantially increases enrolment of pubescent-age girls.
- Further, the electrification’s links with education, which could be through lighting and use of other equipment, are visible in day-to-day life.
- In fact, there is a strong correlation between electricity consumption per capita and higher scores on the education index across countries.
- In order to improve access to “the bare necessities,” governments have made constant efforts.
- The network of schemes designed to deliver these necessities include inter-alia
- the Swachh Bharat Mission (SBM)
- Rural Drinking Water Programme (NRDWP)
- Pradhan Mantri Awaas Yojana (PMAY), Saubhagya
- Ujjwala Yojana
- These Schemes were equipped with new features such as use of technology, real time monitoring, geo-tagging of assets, social audit, embedded digital flow of information, and direct benefit transfers wherever possible.
- Objectives
- SBM-Rural: To attain Open Defecation Free (ODF) India by 2nd October, 2019 by providing access to toilet facilities to all rural households in the country.
- SBM-Urban: To achieve 100 per cent Open Defecation Free (ODF) status and 100 per cent scientific processing of the Municipal Solid Waste (MSW) being generated in the country
- To provide housing for all in urban and rural areas by 2022
- As of 18th January, 2021 109.2 lakh houses have been sanctioned out of which 70.4 lakh houses have been grounded for construction of which 41.3 lakh have been built to the benefi ciaries under PMAY(U) since inception of the scheme in June, 2015.
- The target number of houses for construction under PMAY (Gramin) is 2.95 crore in two phases e.
- 00 crore in Phase I (2016-17 to 2018-19)
- 95 crore in Phase II (2019-20 to 2021-22)
- Objectives
- To achieve universal household electrification by providing electricity connections to all willing un electrified households in rural areas and all willing poor households in urban areas in the country, by March, 2019.
- All States have declared electrification of all households on Saubhagya portal, except 18,734 households in Left Wing Extremists (LWE) affected areas of Chhattisgarh as on 31.03.2019.
- Electricity connections to 262.84 lakh households have released from 11.10.2017 to 31.03.2019
- Subsequently, seven States reported that 19.09 lakh un-electrified households identified before 31.03.2019, which were earlier un-willing but have expressed willingness to get electricity connection.
- States have been asked to electrify these households under Saubhagya.
- These households are being electrified by the concerned States and as on 20.12.2019, electricity connections to 7.42 lakh Households have been released.
- Objectives
- To provide clean cooking fuel to poor households with a target to provide 8 crore deposit free LPG connection.
- Targets and achievements
- A target to provide 8 crore new LPG connections has been achieved in September, 2019, in advance of the target date of 32st March, 2020
- Using the composite index of bare necessities, the above analysis summarizes the progress made in providing access to bare necessities for ensuring a healthy living. However, while improvements in access to bare necessities are evident, the disparities in access to bare necessities continue to exist between rural-urban, among income groups and also across States. Government schemes, may design appropriate strategy to address these gaps to enable India achieve the SDG goals. There should be effective targeting of the needier population be they in urban or rural areas or across states.